Supporting the optimistic outlook are both derivative data and onchain metrics, which indicate increased accumulation and a surge in bullish bets from traders, suggesting that a breakout could be on the horizon for memecoins.
The rebound in memecoin prices has seen the total market capitalization of the sector jump to reach a three-week high of $55.75 billion as of July 7.
The last time the memecoin market cap was below $56 billion was on June 16, when it rested at $56.85 billion. The aggregate market value of cryptocurrencies in this sector is down 3.5% over the last 24 hours.
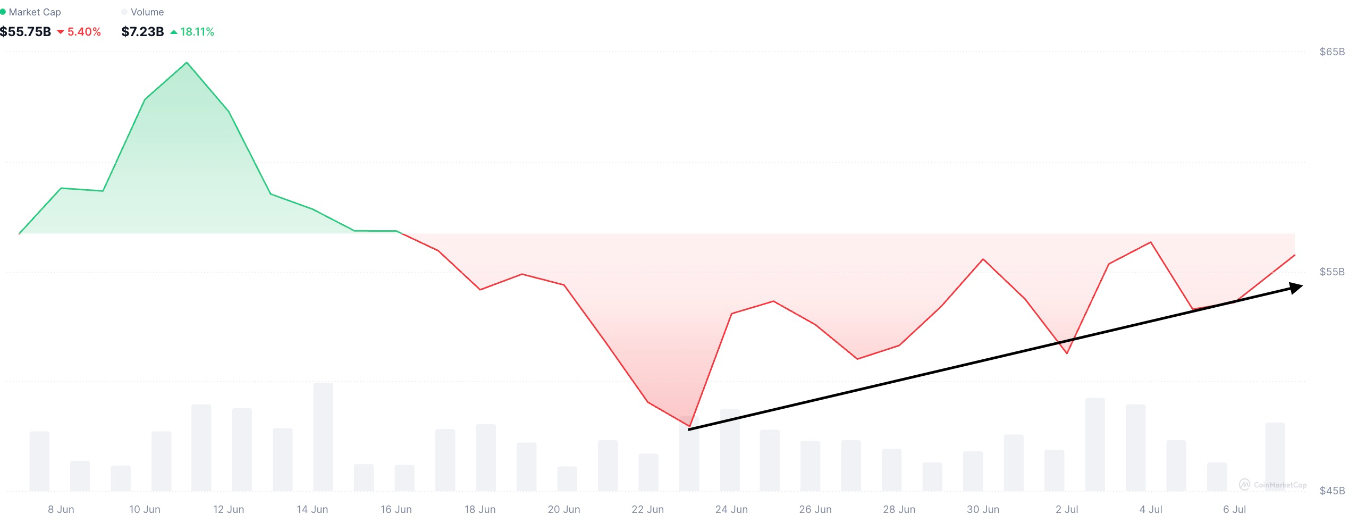 Memecoin Market Capitalization / Daily Trading Volume. Source: CoinMarketCap
The total daily trading volume across the memecoin sector has also jumped 55% over the same period, indicating the intensity of the buying pressure experienced within the sector over the past 24 hours.
Dogecoin, the largest memecoin by market capitalization, led the gains, rising 4.5% over the last 24 hours. DOGE’s rival SHIB was up as well, recording 2% daily gains, while Ethereum-based Pepe (PEPE) was up 3.4% to trade at $0.00001002 at the time of writing.
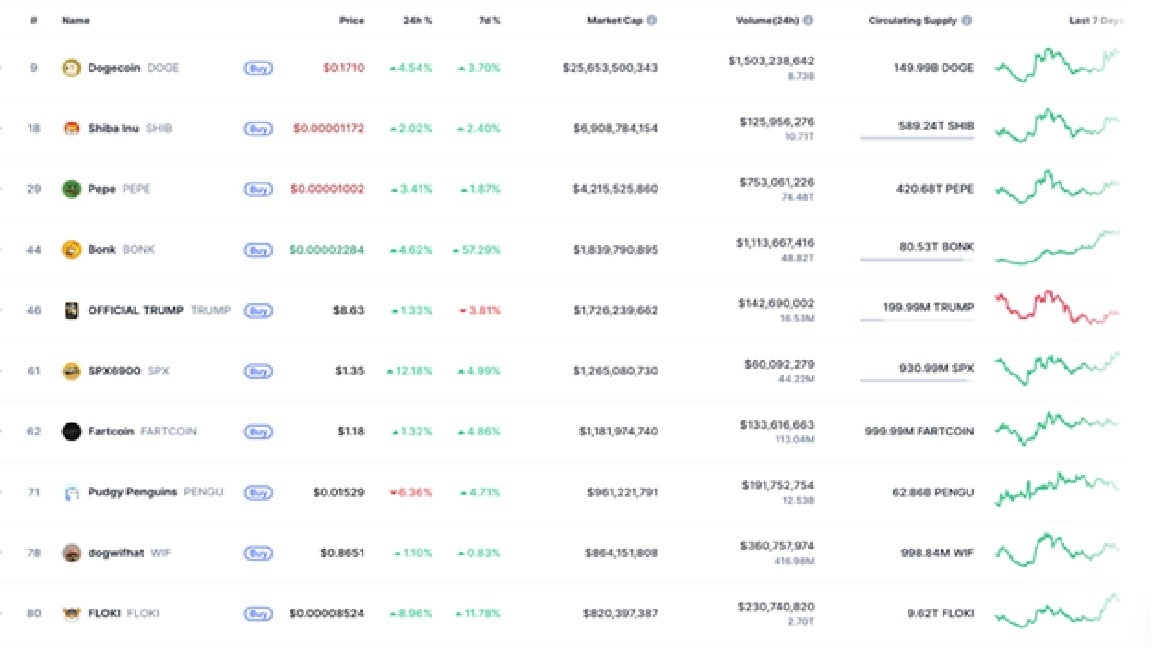
Top Memecoins’ Price Performance. Source: CoinMarketCap
SPX6900 holders realized the most gains, with the community-based memecoin rising by 12% over the last 24 hours to $1.35.
The rise in memecoins on July 7 was preceded by an uptick in open interest (OI), with 1000BONK leading the recovery with a 22% jump in OI over the last 24 hours.
Open interest refers to the total amount of pending derivative contracts that have not yet been settled. In a futures contract, for every seller, a buyer is required to settle the contract.
DOGE saw its IO climb by over 7.6% on the day to $2.09 billion, nearly three times FARTCOIN’s $745 million in OI, which had increased by 8.5% over the same period. PEPE’s OI stood at $926 million, up approximately 1.4% over the last 24 hours.
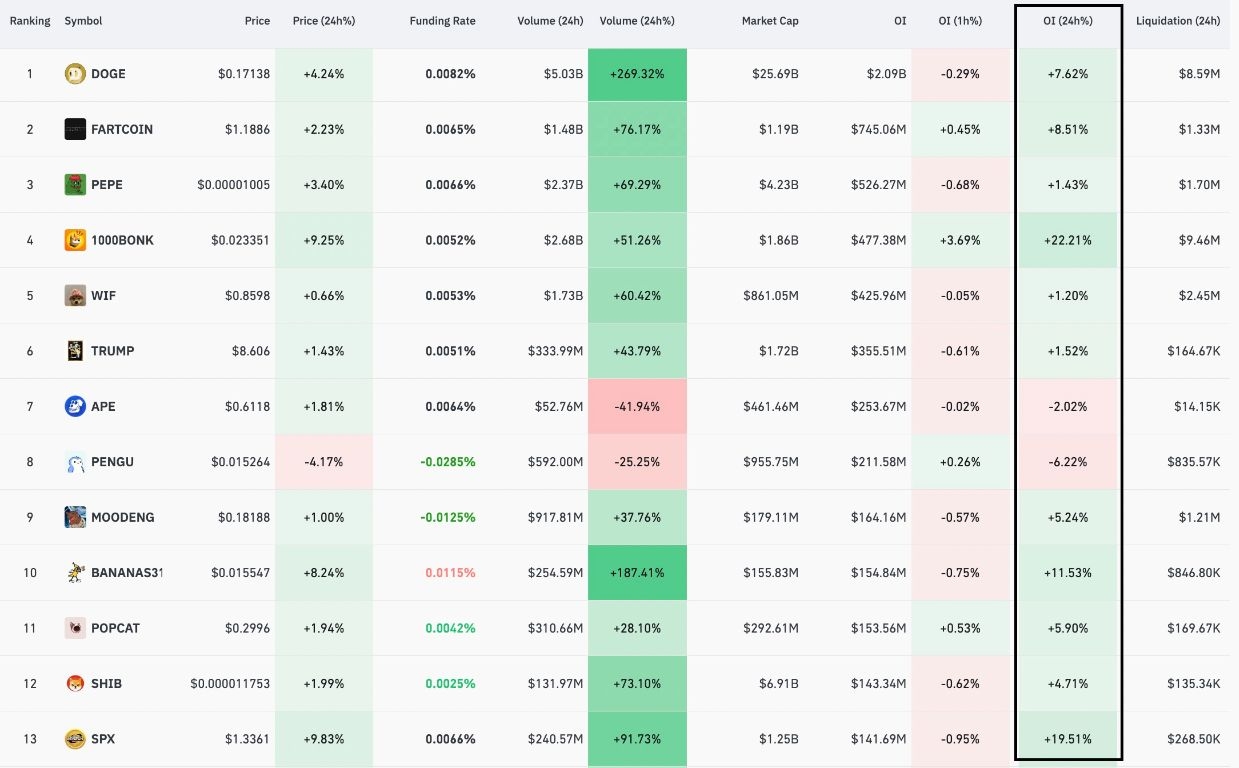 Memecoin OI Chart. Source: CoinGlass
The chart above also revealed a notable increase in the daily trading volume of memecoins in the derivatives market, with DOGE leading the charge by 269%.
The rise in OI and the trading volume for memecoins indicates bullish momentum in the market as leverage traders open more contracts in anticipation of price increases.
Additional onchain data reveals that a growing accumulation is taking place among holders of the two largest memecoins by market capitalization: DOGE and SHIB, according to data from market intelligence firm Santiment.
The Supply Distribution charts below show that the number of large-wallet holders is rising for both dog-theme-based memecoins. The metric indicates that the whales holding between 100,000 and 1 million (red line) and between 1 million and 10 million (yellow line) for SHIB and DOGE tokens have been increasing over the last seven days, further supporting the bullish outlook.
 DOGE & SHIB Supply Distribution. Source: Santiment
Data from CoinMarketCap and TradingView shows DOGE trading above an ascending triangle in the four-hour time frame, as shown in the chart below.
The price broke above the resistance line of the prevailing chart pattern at $0.1716 to continue the upward trajectory, with a measured target of $0.2030. Such a move would bring the total gain to 18.6% from the current level.
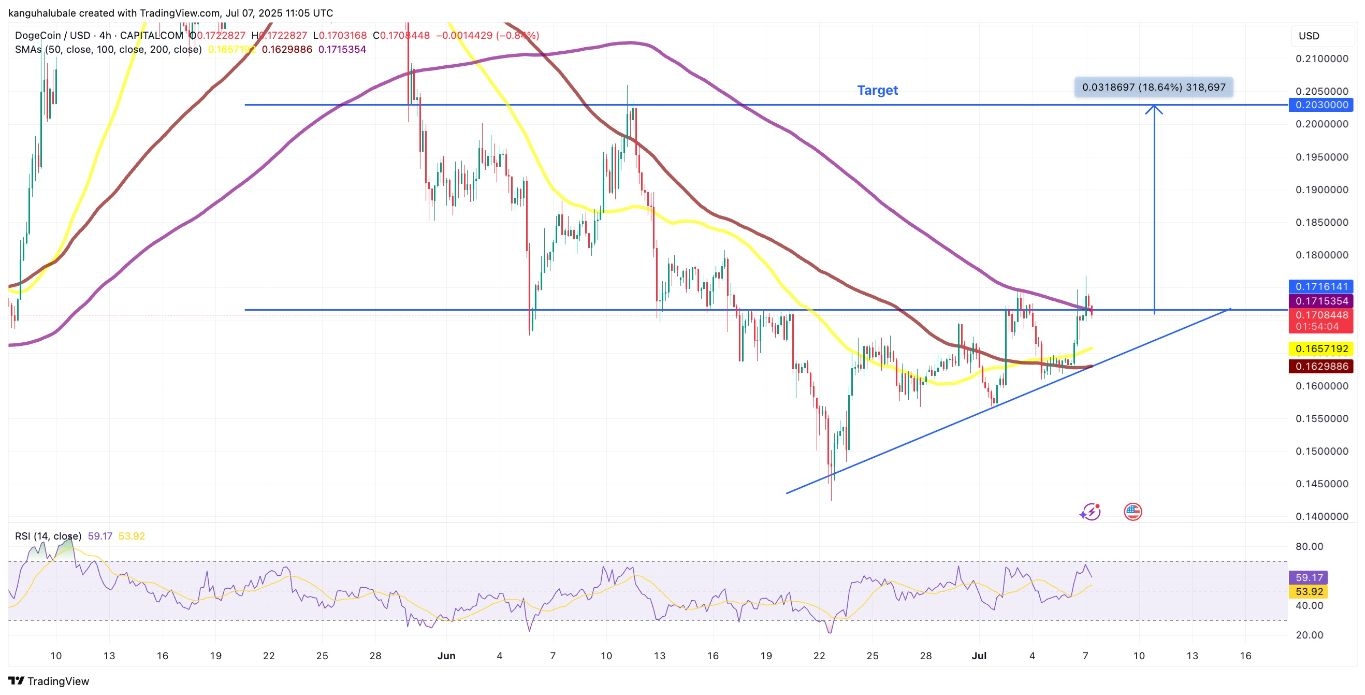 DOGE/USD 4-Hour Price Chart. Source: TradingView
The triangle formed after a 20% recovery to $0.1716 from a multimonth low of $0.1424 reached on June 22. This suggests that Dogecoin’s price was likely coiling before resuming its up move.
The daily chart shows Shiba Inu’s price trading above a falling wedge pattern, with the price enjoying support from the pattern’s upper trendline at $0.00001120, which was breached on June 24. A daily close above $0.000012256, where the 50-day simple moving average (SM) and the 100-day SMA appear to converge, will clear that path for SHIB’s rise toward the wedge’s target at $0.00001430, representing a 22% increase from the current price.
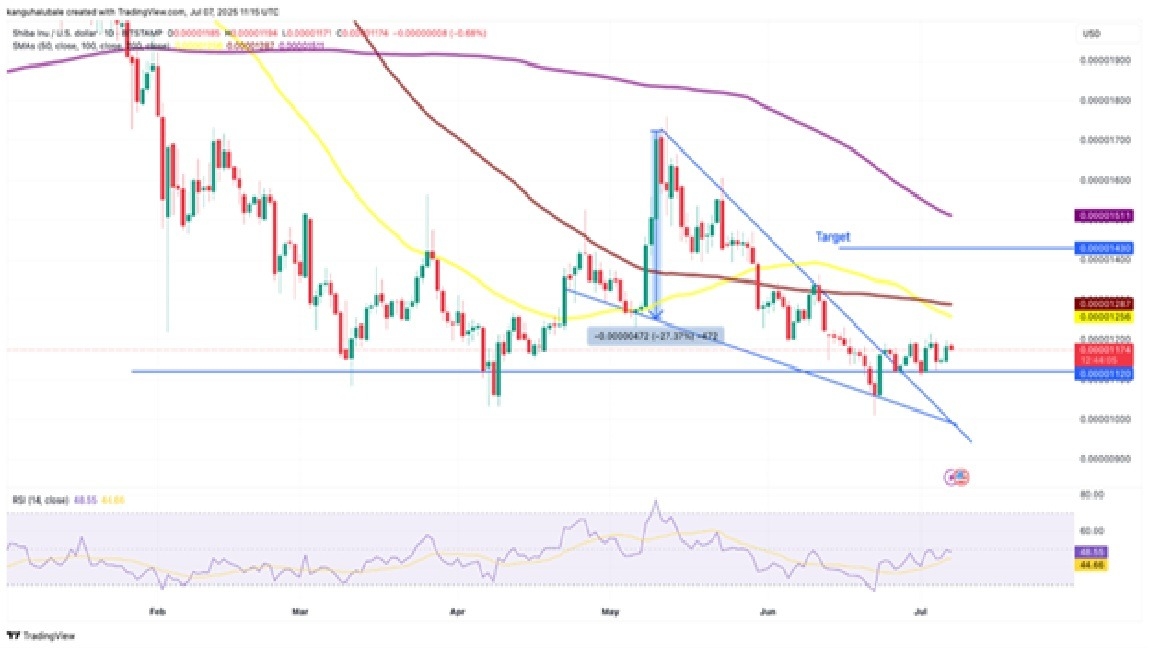 SHIB/USD Daily Price Chart. Source: TradingView
Falling wedges are typically bullish reversal patterns, and Shina Inu’s continued consolidation above the pattern’s breakout point suggests that the upside is not over.
Ready to trade our technical analysis of Doge and Shiba Inu? Here’s our list of the best MT4 crypto brokers worth reviewing.
