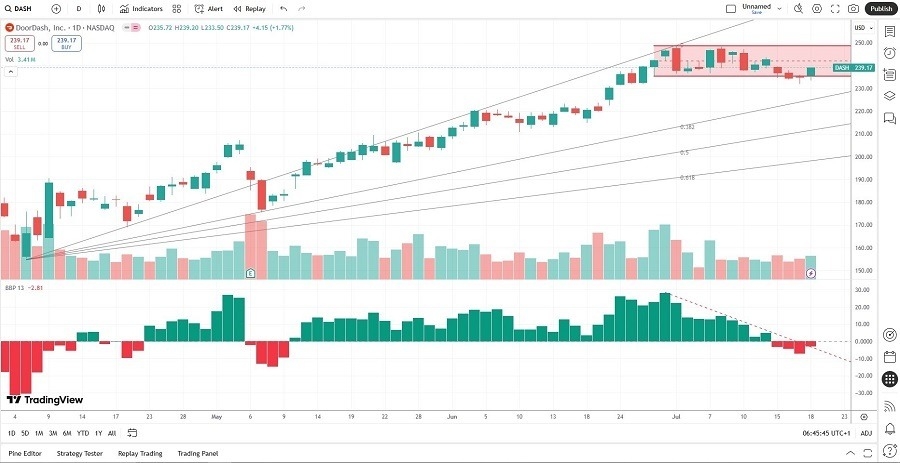
Short Trade Idea
Enter your short position between 235.68 (the lower band of its horizontal resistance zone) and 248.74 (its 52-week high and the upper band of its horizontal resistance zone).
Market Index Analysis
- DoorDash (DASH) is a member of the NASDAQ 100 and the S&P 500.
- Both indices remain near record highs with rising bearish trading volumes.
- The Bull Bear Power Indicator of the S&P 500 shows a negative divergence.
Market Sentiment Analysis
The trading week started muted. Traders digest more tariff commentary over the weekend and await more earnings. Commerce Secretary Lutnick confirmed the August 1st deadline as a hard deadline when tariffs will kick in, but he added that countries can negotiate past the deadline to reach a deal. Traders await earnings from Alphabet and Tesla on Wednesday. 86% of the 59 S&P 500 companies that reported earnings beat expectations, which were modest amid tariff uncertainty. Volatility should continue increasing this week.
DoorDash Fundamental Analysis
DoorDash is the largest food delivery company in the US, with a market share of 56% and a 60% market share in convenience store deliveries. It caters to over 450,000 merchants, over 20,000,000 users, and employs over 1,000,000 couriers.
So, why am I bearish on DASH after its downgrades?
Its valuations are higher than most AI-related stocks, which raises a significant red flag. DoorDash also features low profit margins, destroys shareholder value, and is one step away from entering meme stock frenzy. The balance sheet is not as healthy as I would like from a company with its valuations, and the health of the consumer, albeit resilient, is another reason to worry about future earnings and already low profit margins.

The price-to-earnings (PE) ratio of 302.75 makes DASH an unacceptably expensive stock. By comparison, the PE ratio for the S&P 500 is 29.06.
The average analyst price target for DASH is 224.09. It has higher downside risks than upside potential, especially considering recent downgrades.
DoorDash Technical Analysis
Today’s DASH Signal

DASH Price Chart
- The DASH D1 chart shows price action inside a horizontal resistance zone.
- It also shows detachment from the ascending 0% Fibonacci Retracement Fan level.
- The Bull Bear Power Indicator is bearish and has been contracting for three weeks.
- The average trading volumes are higher during selloffs than during rallies.
- DASH corrected as the S&P 500 rallied to fresh highs, a significant bearish development.
My Call
I am taking a short position in DASH between 235.68 and 248.74. The valuations are higher than those for AI-related stocks, the price has rallied despite underlying fundamental issues, and I expect a mean reversion.
- DASH Entry Level: Between 235.68 and 248.74
- DASH Take Profit: Between 175.50 and 195.42
- DASH Stop Loss: Between 256.21 and 261.32
- Risk/Reward Ratio: 2.93
Ready to trade our free signals? Here is our list of the best brokers for trading worth checking out.
