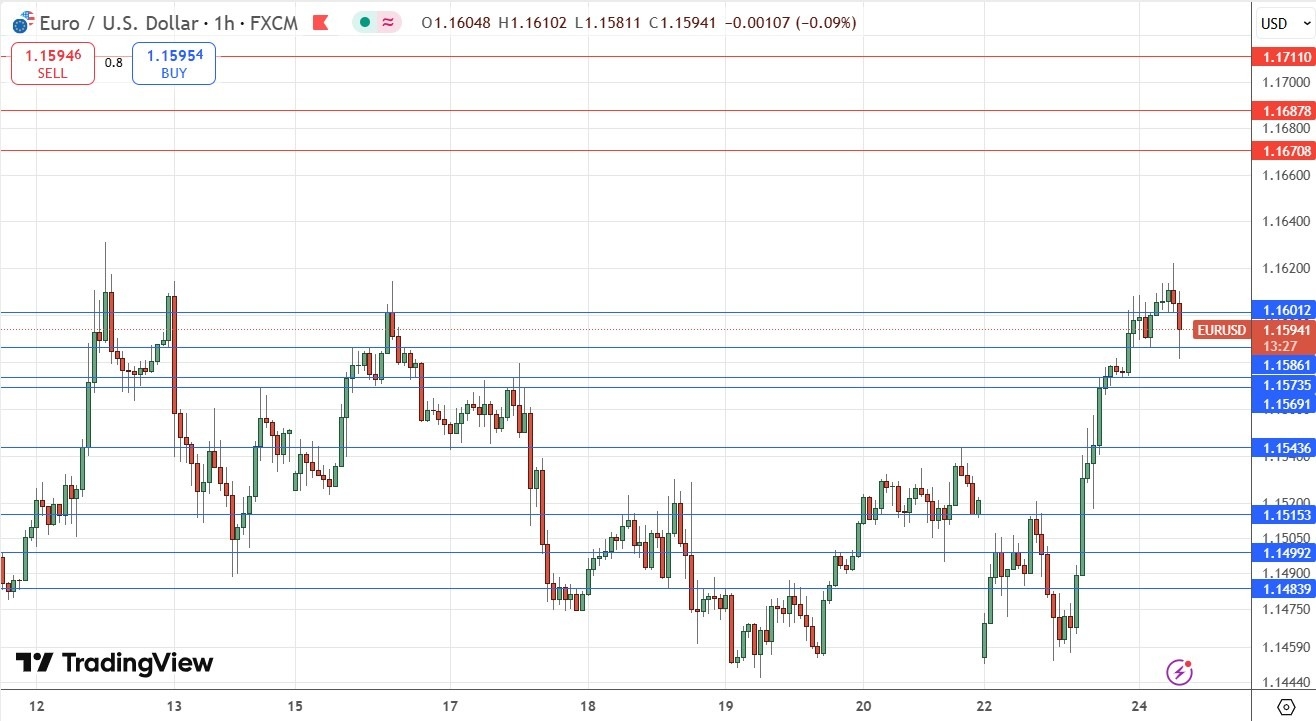
My previous EUR/USD signal on 17th June gave a profitable short trade from the engulfing bar reversal at the resistance level of $1.1569 on the H1 price chart.
- Risk 0.75%.
- Trades may only be taken before 5pm London time today.
- Go short following a bearish price action reversal on the H1 timeframe immediately upon the next touch of $1.1671, $1.1688, or $1.1711.
- Place the stop loss 1 pip above the local swing high.
- Move the stop loss to break even once the trade is 20 pips in profit.
- Remove 50% of the position as profit when the price reaches 20 pips in profit and leave the remainder of the position to ride.
- Go long following a bullish price action reversal on the H1 timeframe immediately upon the next touch of $1.1601, $.1586, or $1.1574.
- Place the stop loss 1 pip below the local swing low.
- Move the stop loss to break even once the trade is 20 pips in profit.
- Remove 50% of the position as profit when the price reaches 20 pips in profit and leave the remainder of the position to ride.

The best method to identify a classic “price action reversal” is for an hourly candle to close, such as a pin bar, a doji, an outside or even just an engulfing candle with a higher close. You can exploit these levels or zones by watching the price action that occurs at the given levels.
In my previous EUR/USD analysis one week ago, I thought that the EUR/USD currency pair was showing bearish price action, rejecting $1.1569.
This was a good call, as that bearish rejection gave a good profitable day or even swing trade entry.
The picture is looking more bullish now in many ways, with the price close to its multi-year high price, rising as it prints new support levels which are clustered closely together right below the current price.
In terms of key horizontal levels, the price has plenty of room to rise from here. However, a look at the candlestick price action the last times the price was in this area, shows the potential conclusion of a triple bearish top. It may be that there is downwards pressure in this area well before $1.1671.
This pair has a history of trending very reliably. The general risk bullishness generated by the Israel / Iran ceasefire should keep the US Dollar weaker, enabling the price to rise yet higher here.
I am only looking for long trades here from bounces off support levels.
If the price starts to easily slice through the support levels shown in my price chart, that will be a very bearish sign.
The spike lower that was just seen was due to Iran firing at least one ballistic missile at Israel almost four hours after the ceasefire came into effect. This caused jitters in the market, but participants are still counting on the ceasefire more or less holding.
There is nothing of high importance due today regarding the Euro. Concerning the USD, Fed Chair Jerome Powell will be testifying on monetary policy before the House of Congress at 3pm London time.
Ready to trade our daily Forex signals? Here is our list of the top 10 Forex brokers in the world worth checking out.
