American Express Company (NYSE: AXP), a leading multinational financial services corporation based in New York City, continues to solidify its position as a prominent player among the Dow Jones Industrial Average’s 30 components. As it specializes in payment cards, the company consistently demonstrates significant market performance, further enhancing its reputation.
Meanwhile, analysts hold mixed opinions regarding American Express (AXP). While the stock carries a consensus rating of “Hold,” evaluations from 24 analysts reveal varying perspectives. Notably, 8 recommend buying, 15 suggest holding, and 1 advises selling. Moreover, the average price target currently stands at $295.05, with projections ranging from a high of $370.00 to a low of $235.00. For instance, some analysts, such as Wells Fargo, have raised their price target to $370.00, reflecting an optimistic outlook on AXP’s growth potential. However, on the other hand, some express concerns about short-term performance, which has resulted in sell ratings.
American Express (AXP) Elliott Wave view
Utilizing Elliott Wave Principle, AXP’s movements reveal an ongoing bullish trajectory, with extensions continuing to attract strategic interest. Let’s examine how the structure has been developing over the past year.
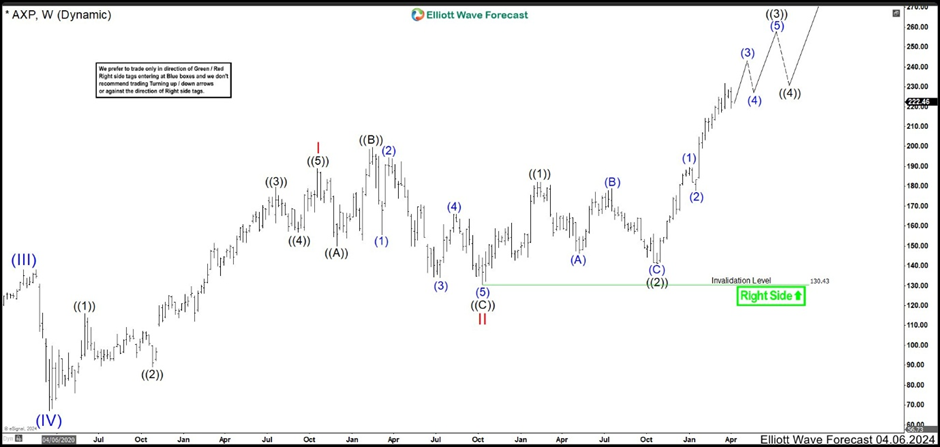
April 2024:

In April 2024, AXP advanced confidently as wave (V) of ((I)). Wave I reached its peak at 189.03 high before wave II corrected to 130.65 low. From there, the stock launched into strong rallies, marking wave ((3)) of III, and created ideal buying opportunities for traders aligned with the trend.
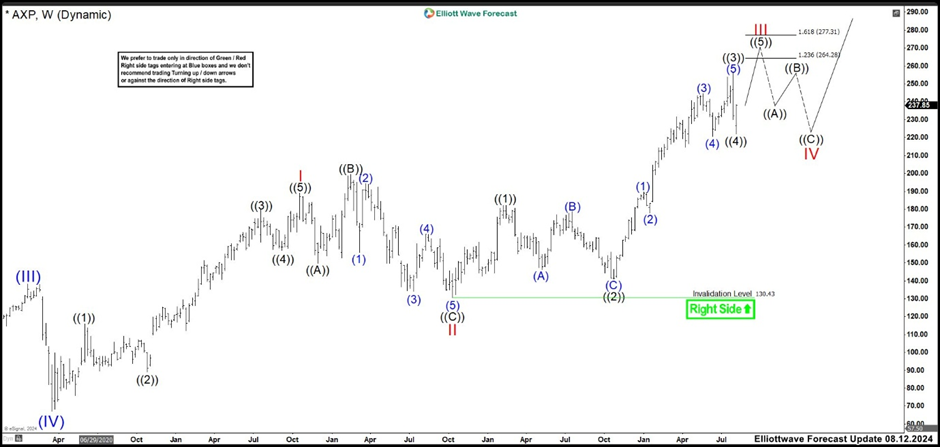
August 2024:

After 4 months, AXP peaked at 256.24 high as wave ((3)), followed by a significant pullback as wave ((4)), which retested the previous wave (4) low around 222.03. The market continued to the upside in wave ((5)). If there was not more extension, this wave ((5)) of III was expected to reach the 264.28–277.31 zone, signaling the potential start of a larger wave IV correction.
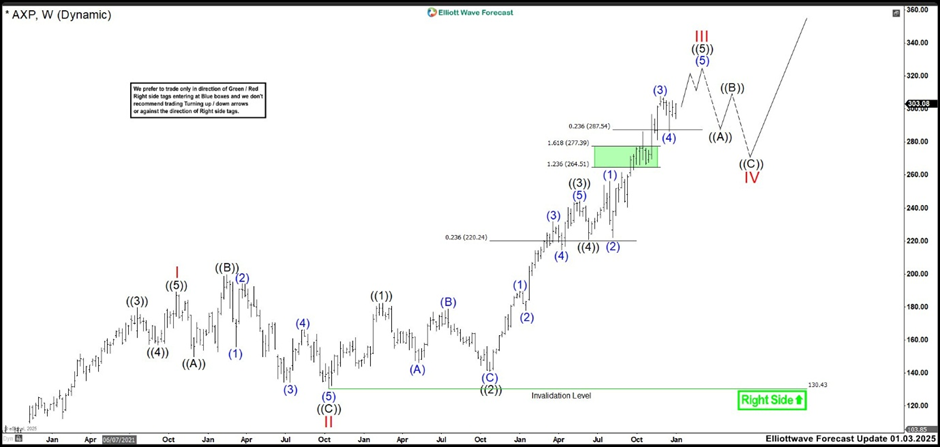
January 2025:

As January 2025 unfolded, the rally surpassed expectations, reaching the upper range of 264.28–277.31. Wave ((5)) of III continued its extension, with bullish momentum still dominating. The cycle was expected to conclude around 320.00, where AXP could initiate a pullback in wave IV. The first target for this pullback would likely involve a retest of the prior wave (4) support, approximately in the 280.00–290.00 area.
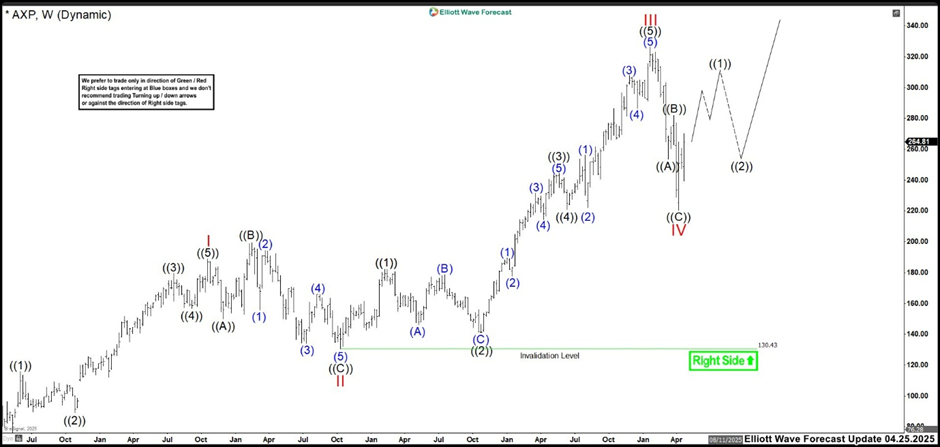
April 2025:

The price action of AXP completed wave ((5)) of III at the high of 326.27 and then reversed sharply to the downside. The market attempted to rebound near 290, close to the beginning of wave (4), but sellers took control and broke the support, initiating the wave IV pullback. Wave IV formed a corrective zigzag structure, revisiting the zone of the previous wave ((4)). This correction ended at the low of 220.43. At this stage, we expect the bullish movement to persist until wave ((1)) is completed, followed by a correction in wave ((2)). This correction should remain above the low of wave IV to keep the bullish scenario valid. Once wave ((2)) retracement is completed, the market is likely to accelerate toward new highs, potentially reaching the target of 351.70 – 392.36 zone.

