In this technical article, we are going to present Elliott Wave charts of QQQ ETF . As our members know QQQ has recently bounce from the Equal Legs area. The EWF has reached the extreme zone from the 540.6 peak and found buyers as expected. In the following sections, we will explain the Elliott Wave forecast.
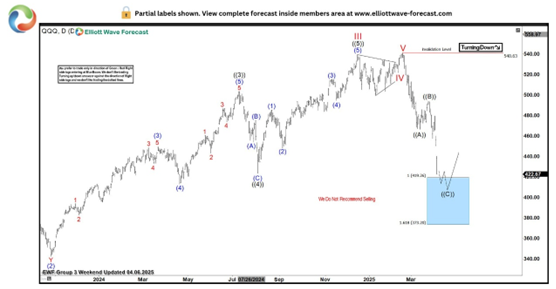
QQQ Elliott Wave one-hour chart 04.06.2025
The current view suggests QQQ is trading within the cycle from the 540.63 peak that is unfolding as a Elliott Wave Zig Zag pattern. We expect an extension toward the extreme zone at 419.26-373.2 . At that zone buyers should re-enter, which could lead to a further rally in a 3 waves bounce at least. We recommend that members avoid selling QQQ .
Official trading strategy on How to trade 3, 7, or 11 swing and equal leg is explained in details in Educational Video, available for members viewing inside the membership area.

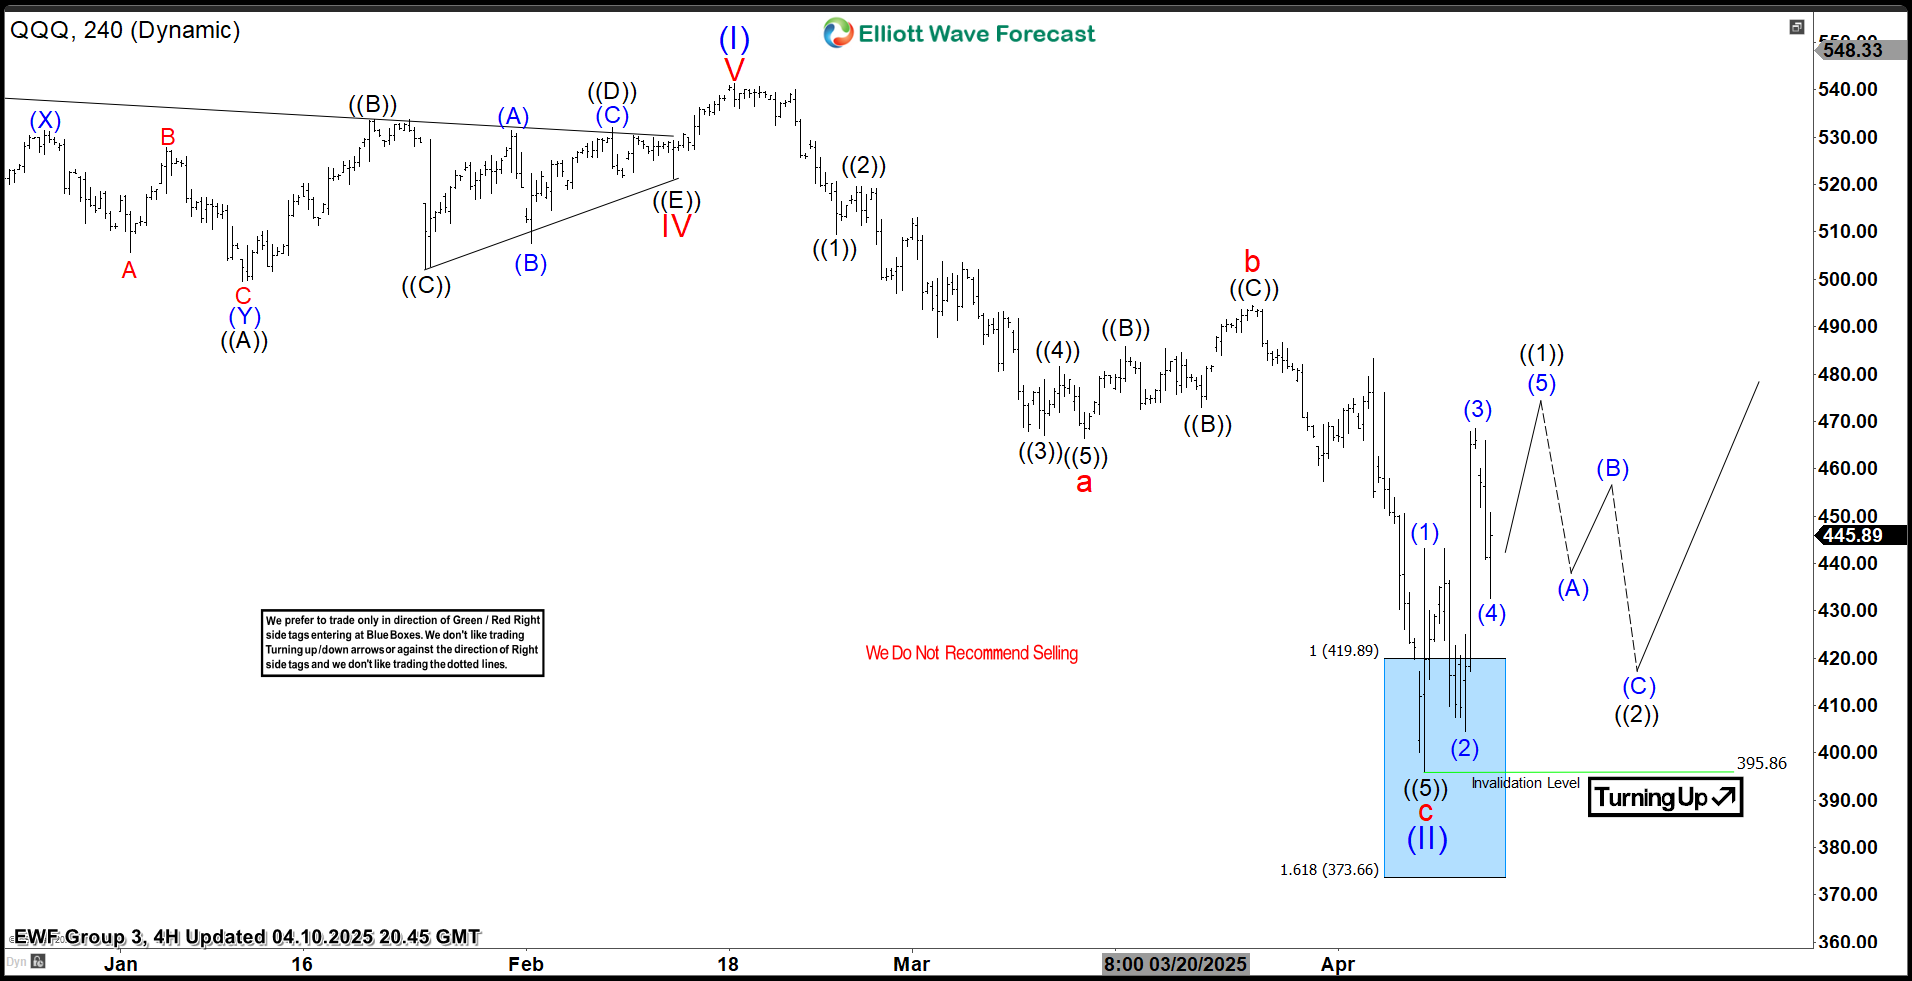
QQQ Elliott Wave one-hour chart 04.10.2025
The ETF made made extension down and reached Equal Legs area as expected. QQQ found buyers, and made decent reaction from the Blue Box zone. Cycle from the peak ended at 395.86 low. As far as the mentioned pivot holds, we can see further strength in the ETF. As a result, members who took the long trades are enjoying profits in risk-free positions. The 395.86 level remains key for the current bullish outlook to stay valid.


