Bearish view
- Sell the GBP/USD pair and set a take-profit at 1.3400.
- Add a stop-loss at 1.3600.
- Timeline: 1-2 days.
Bullish view
- Buy the GBP/USD pair and set a take-profit at 1.3600.
- Add a stop-loss at 1.3400.

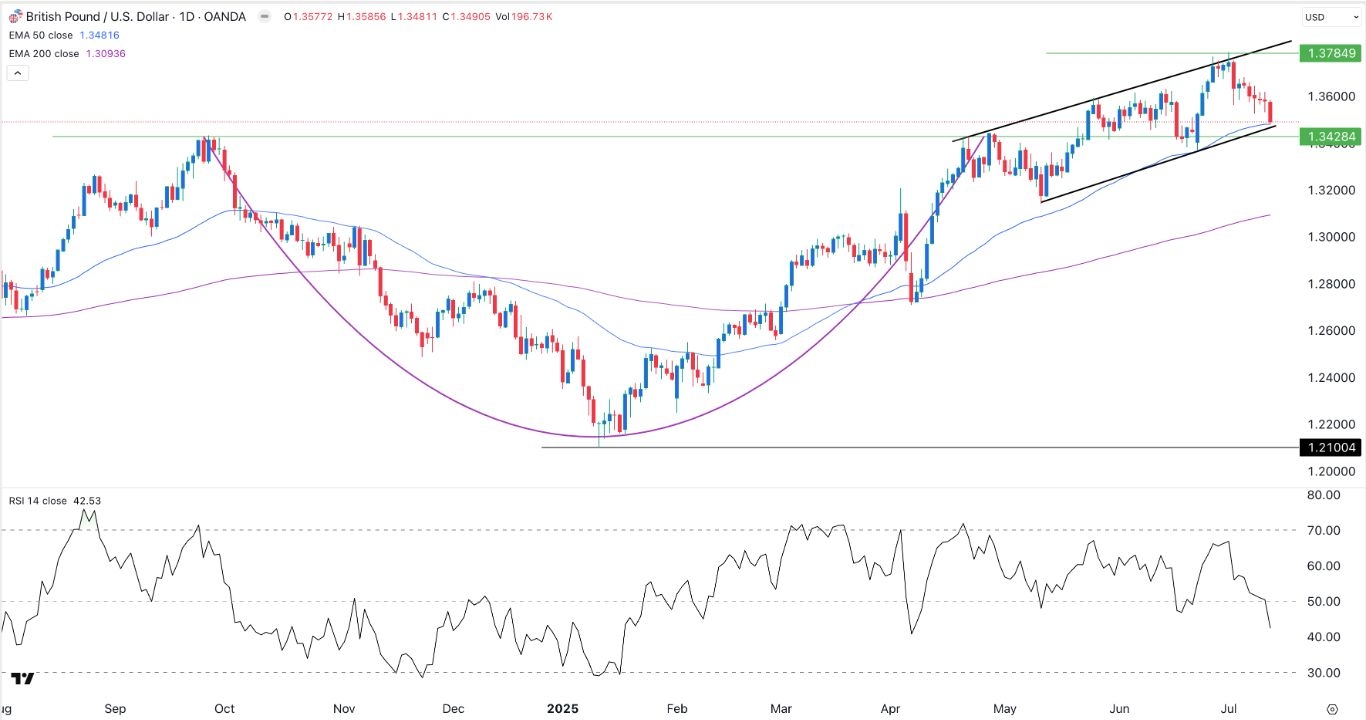
The GBP/USD exchange rate has pulled back in the past few weeks and moved to its lowest level since June 23rd. It moved from the year-to-date high of 1.3785 to 1.3490 as investors wait for the upcoming US and UK inflation data.
UK and US Inflation Data Ahead
The GBP/USD exchange rate has plunged in the past few days as the recent rally lost momentum and investors took profits. It has pulled back as the US dollar bounced back from its highest point this year.
The pair also retreated after odds of a Federal Reserve interest rate cut in July dropped after the US published strong jobs data.
A report by the Bureau of Labor Statistics (BLS) showed that the unemployment rate dropped to 4.1% in June as the economy created over 147k jobs during the month. The job additions were higher than what analysts were expecting.
Minutes released last week showed that most Fed officials believe that Trump’s tariffs will have an impact on inflation. Most of them expect the bank to start cutting rates in the September or October meetings.
The next key catalyst for the BTC/USD pair is the upcoming US Consumer Price Index (CPI) data scheduled on Wenesday. This report will provide more information about the impact of tariffs on the economy.
Economists expect the data to show that the headline consumer inflation jumped to 2.5% in June. Core inflation, which most traders and Fed officials watch, is expected to come in at 2.9%.
A higher inflation reading than expected will validate the Federal Reserve’s fear and point to a more hawkish view.
The GBP/USD pair will also react to the upcoming UK Consumer Price Index (CPI) data expected on Wednesday this week.
GBP/USD Technical Analysis
The daily chart shows that the GBP/USD exchange rate has pulled back in the past few weeks. It has moved from the year-to-date high of 1.3785 to 1.3490 today.
The pair has retested the lower side of the ascending channel as the sell-off continued. It has remained above the 50-day and 100-day Exponential Moving Averages (EMA).
The Relative Strength Index (RSI) has moved below the neutral point at 50. Also, the Stochastic and Relative Strength Index (RSI) have pointed downwards. Therefore, the pair will likely continue falling as sellers target the support at 1.3400.
Ready to trade our free daily Forex trading signals? We’ve shortlisted the best UK forex broker in the industry for you.
Crispus Nyaga is a financial analyst, coach, and trader with more than 8 years in the industry. He has worked for leading companies like ATFX, easyMarkets, and OctaFx. Further, he has published widely in platforms like SeekingAlpha, Investing Cube, Capital.com, and Invezz. In his free time, he likes watching golf and spending time with his wife and child.
