Bullish view
- Buy the GBP/USD pair and set a take-profit at 1.3015.
- Add a stop-loss at 1.2850.
- Timeline: 1-2 days.
Bearish view
- Set a sell-stop at 1.2935 and a take-profit at 1.2850.
- Add a stop-loss at 1.3015.

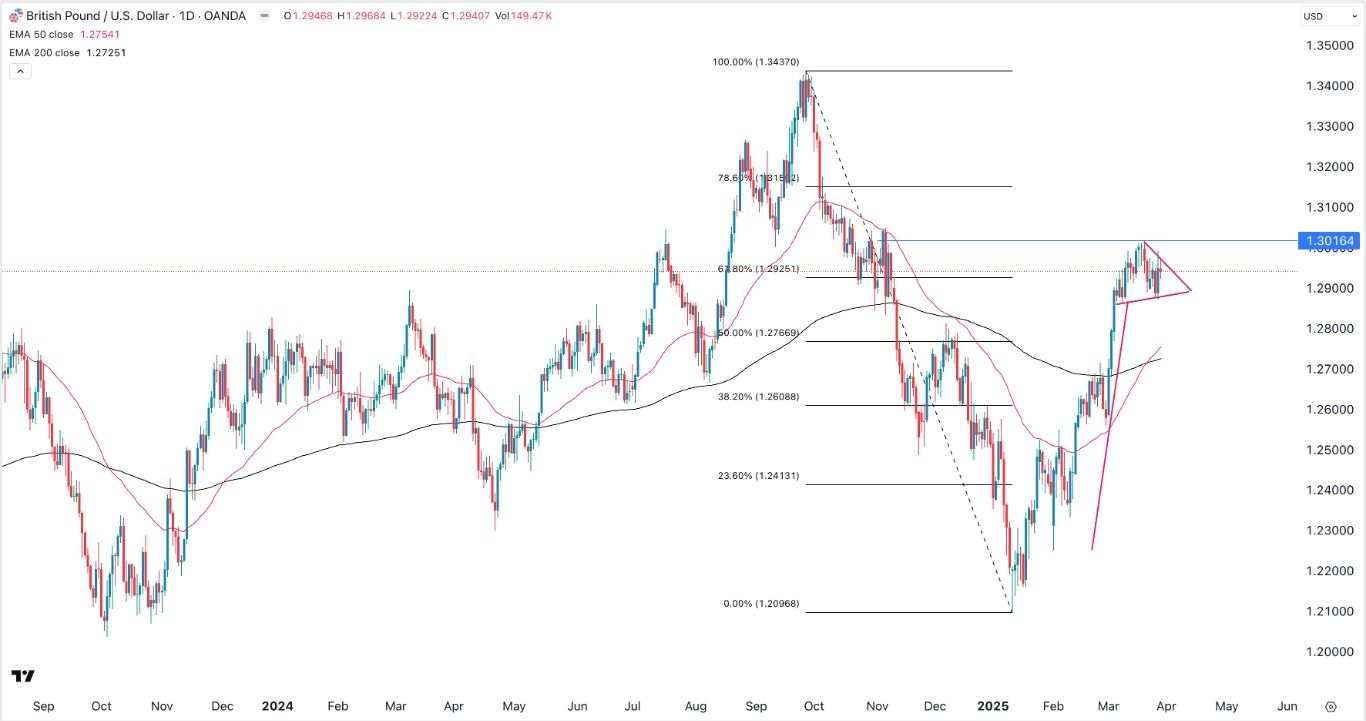
The GBP/USD exchange rate remained tight range near its November highs after a series of mixed economic numbers from the UK. It was trading at 1.2940 on Monday, down slightly from this year’s high of 1.3016.
US Liberation Day tariffs ahead
The GBP/USD pair retreated slightly afte the UK released encouraging inflation data on Wednsday. Data by the Office of National Statistics (ONS) showed that the headline Consumer Price Index (CPI) slipped from 2.9% in January to 2.8% in February. Core inflation moved from 3.6% to 3.5%, remaining much higher than the Bank of England’s target of 2.0%.
On the positive side, there are signs that UK’s consumer spending rose during the month, helping to support the economy. The headline retail sales rose by 2.2% in February after rising by 0.6% a month earlier. Core retail sales, which excludes the volatile food and energy prices also by 2.2%,
Another report showed that the UK’s economy expanded slightly in the fourth quarter. It grew by 1.5% in Q4 after rising by 1.4% a quarter earlier. These numbers came a week after the Bank of England left interest rates unchanged in its meeting in February.
The GBP/USD pair also reacted to the Federal Reserve’s favorite inflation data. The PCE and core PCE figures remained above 2.5% in February, a sign that inflation is still high in the US.
Looking ahead, S&P Global will publish the manufacturing PMI numbers from the UK and the US on Tuesday. These numbers will provide more information on whether the sector continued growing in March.
The most important catalyst for the GBP/USD pair will be Trump’s Liberation Day tariffs on Wednesday. Trump has pledged to impose large tariffs on goods from other countries, including the UK. It is unclear the size of the tariffs that will be implemented on the UK, a country that has a trade deficit with the UK.
GBP/USD technical analysis
The GBP/USD pair bottomed at 1.2095 earlier this year and then bounced back to a high of 1.2940. It has moved slightly above the 61.8% Fibonacci Retracement level at 1.2925.
The pair has formed a golden cross pattern as the 50-day and 200-day moving averages have crossed each other. This pattern is one of the most bullish signs in technical analysis.
The pair has also formed a bullish pennant pattern, comprising a long vertical line and a symmetrical triangle. The two lines of this triangle are about to converge, which will lead to more upside, potentially to 1.3100.
Ready to trade our free daily Forex trading signals? We’ve shortlisted the best UK forex brokers in the industry for you.
