Bullish view
- Buy the GBP/USD pair and set a take-profit at 1.3000.
- Add a stop-loss at 1.2795.
- Timeline: 1-2 days.
Bearish view
- Sell the GBP/USD pair and set a take-profit at 1.2795.
- Add a stop-loss at 1.3000.

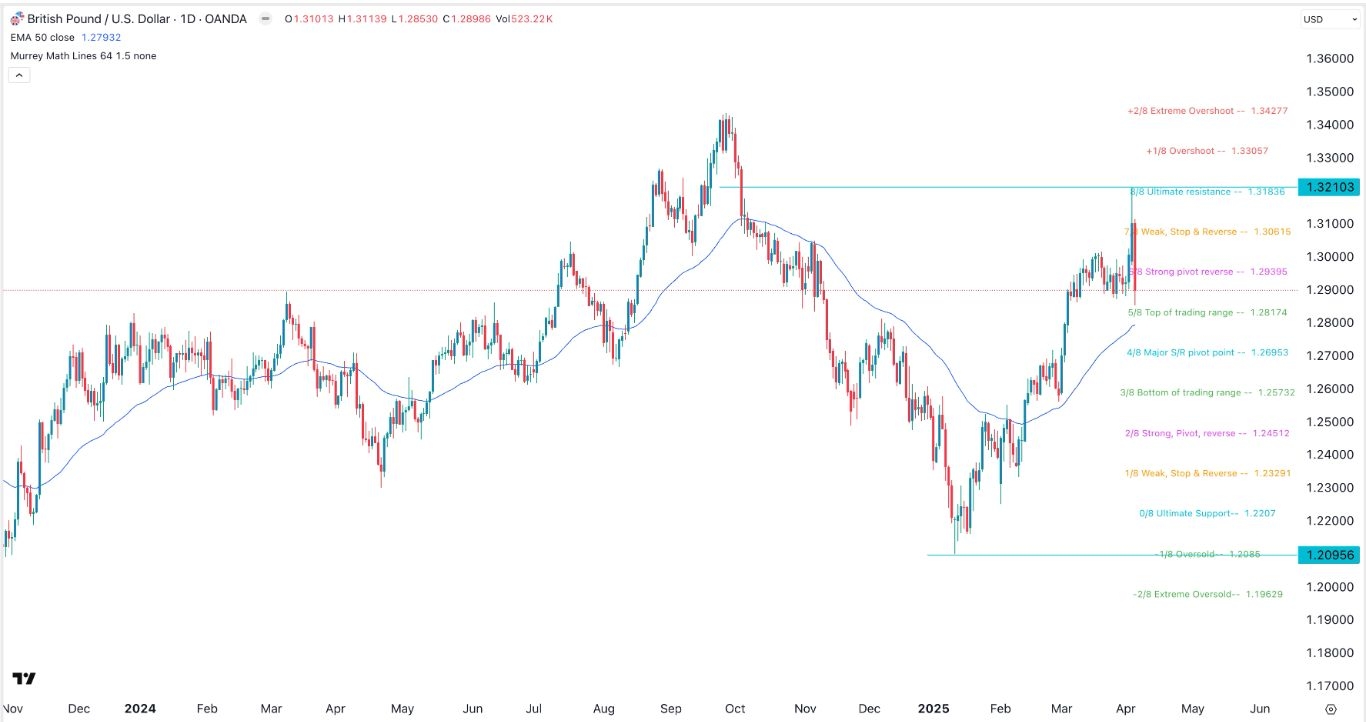
The GBP/USD exchange rate surged to its highest level since October 3 and then quickly erased those gains to 1.2900. This price action happened as investors reacted to the ongoing trade war between the United States and other countries and after the mixed jobs numbers.
Trade war and US inflation data
The GBP/USD pair was highly volatile after President Trump announced his reciprocal tariffs against all countries. His administration will apply a flat import tax of 10% on goods from the United Kingdom, a country with which the US has a large trade surplus.
The US will also levy a tariff of 25% on the UK’s vehicles, steel, and aluminium. There are signs that these tariffs are having an impact as Jaguar Land Rover has paused vehicle exports to the United States as officials assess the impact of these tariffs.
Analysts warn that the US economy will sink into a recession this year if these tariffs remain. This explains why US bond yields and crude oil prices have crashed in the past few days.
The GBP/USD pair also retreated after the US released the latest nonfarm payrolls (NFP) data. According to the Bureau of Labor Statistics (BLS), the economy added 228k jobs in February, higher than the median estimate of 117k.
However, the unemployment rate rose to 4.2%, higher than the median estimate of 4.1%, while wage growth was lower than expected. The average hourly earnings were 3.8%, lower than the consensus estimate of 3.9%.
The next key catalyst for the GBP/USD pair will be the upcoming Federal Reserve minutes scheduled on Wednesday and US inflation data on Thursday. Historically, these events tend to have a major impact on the US dollar, which might not be the case this week.
GBP/USD technical analysis
The GBP/USD pair has risen in the past few months as the US dollar softened. It moved from a low of 1.2095 in January to 1.3210 last week.
It then pulled back and moved slightly below the strong pivot reverse point of the Murrey Math Lines at 1.2949.
The pair remains slightly above the 50-day Exponential Moving Average (EMA), a sign that the uptrend is still intact. Therefore, there is a likelihood that the volatility will continue in the next few days as the tariff issue evolves. The key support and resistance levels to watch will be at 1.2800 and 1.3065.
Ready to trade our free trading signals? We’ve made a list of the best UK forex brokers worth using.
