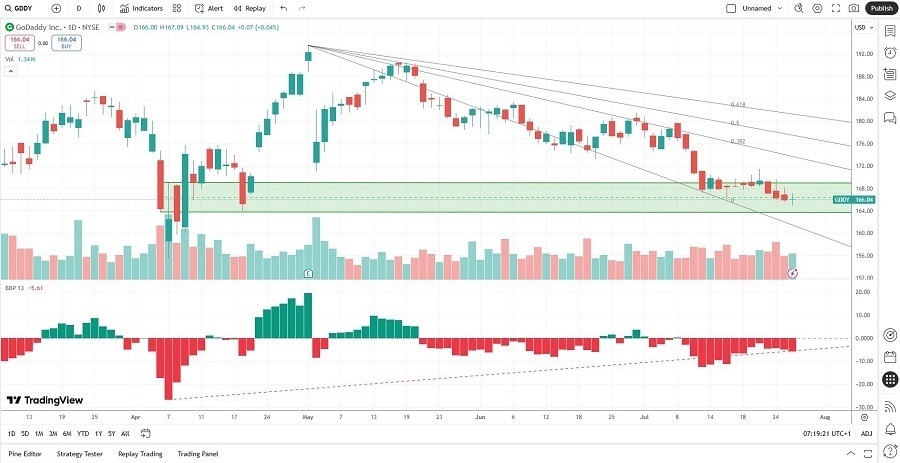
Long Trade Idea
Enter your long position between 163.75 (the lower band of its horizontal support zone) and 169.09 (the upper band of its horizontal support zone).
Market Index Analysis
- GoDaddy (GDDY) is a member of the S&P 500.
- This index is at or near record highs but climbs a wall of worry and remains vulnerable to correction.
- The Bull Bear Power Indicator of the S&P 500 shows a negative divergence.
Market Sentiment Analysis
The US-EU trade deal failed to inspire markets, as US-China trade talks continue. Investors await the outcome of the US Federal Reserve meeting tomorrow, where markets expect no change in interest rates. Q2 earnings might provide market direction and increase volatility. US President Trump noted that baseline tariffs for most countries will range between 15% and 20%. Still, markets appear to be no longer worried about tariff-related impacts and are instead betting on interest rate cuts. China reported its first export-related disappointment, a warning to markets that tariffs influence the economy.
GoDaddy Fundamental Analysis
GoDaddy is the world’s fifth-largest web hosting company with over 20M+ customers. It focuses on micro and small companies.
So, why am I bullish on GDDY despite its sell-off?
GoDaddy remains a fast-growing company with a cloud-based business model and a stable, recurring revenue stream. It is also a tech company that is isolated from tariff-related shocks, as companies must keep their websites online. For a tech company, its valuations are reasonable, and its return on equity is outstanding.
|
Metric |
Value |
Verdict |
|
P/E Ratio |
31.93 |
Bullish |
|
P/B Ratio |
118.47 |
Bearish |
|
PEG Ratio |
2.69 |
Bearish |
|
Current Ratio |
0.56 |
Bearish |
|
ROIC-WACC Ratio |
Positive |
Bullish |
The price-to-earning (P/E) ratio of 31.93 makes GDDY an inexpensive stock for a tech company. By comparison, the P/E ratio for the S&P 500 is 29.48.
The average analyst price target for GDDY is 214.12. It suggests massive upside potential with moderate downside risk.
GoDaddy Technical Analysis
Today’s GDDY Signal

- The GDDY D1 chart shows price action inside a horizontal support zone.
- It also shows price action finding support at the descending 0.0% Fibonacci Retracement Fan level.
- The Bull Bear Power Indicator is bearish, but the trendline is bullish.
- Trading volumes during the last two bullish candles have increased.
- GDDY corrected as the S&P 500 rallied to fresh highs, a significant bearish development, and investors should brace for volatility.
My Call
I am taking a long position in GDDY between 163.75 and 169.09. GDDY has some balance sheet issues, but interest rates have peaked, lowering the threat of short-term balance sheet issues. The recurring revenue stream is solid, and its market position should help GoDaddy weather the storm. I will buy the dip and trust its horizontal support zone at current valuations.
- GDDY Entry Level: Between 163.75 and 169.09
- GDDY Take Profit: Between 185.32 and 193.55
- GDDY Stop Loss: Between 155.50 and 158.60
- Risk/Reward Ratio: 2.61
Ready to trade our free daily signals? Here is our list of the best brokers for trading worth checking out.
