- XAU/USD down 0.60% to $3,334 after US PPI crushes forecasts.
- Hot producer prices revive inflation concerns despite White House push for lower rates.
- US Jobless Claims beat expectations, reinforcing view of a resilient labor market.
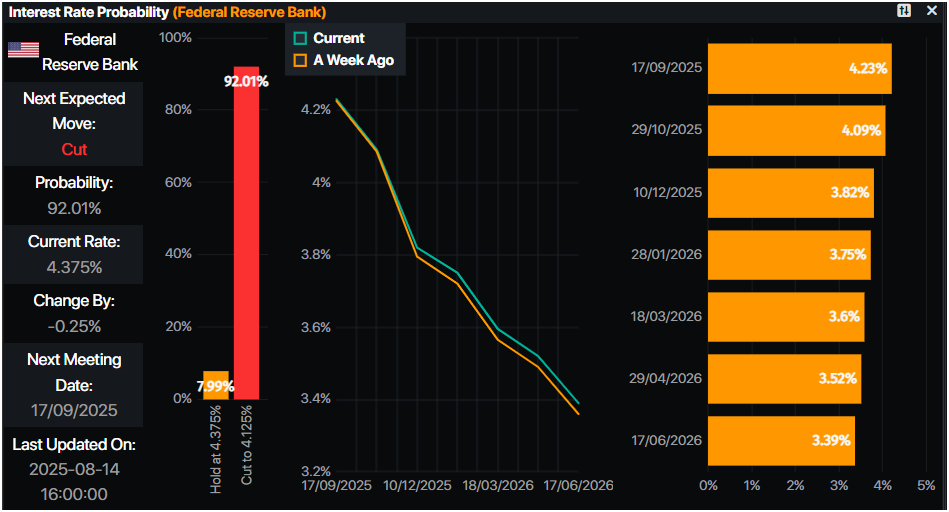
- Traders price in 25 bps September cut with slim odds of Fed holding rates steady.
Gold Price takes a hit and dives over 0.60% on Thursday following a red-hot factory gate inflation report in the United States (US), which prompted investors to price out the chances for a 50-basis-point rate cut at the Federal Reserve’s (Fed) upcoming meeting. The XAU/USD trades at $3,334 at the time of writing.
The US Producer Price Index’s (PPI) July figure from the Bureau of Labor Statistics (BLS) crushed estimates and June’s print. Core PPI soared and was shy of touching 4% amid an environment in which the White House demands lower interest rates, saying that tariffs are not inflation-prone.
Other data revealed that the labor market, which showed signs of weakness, remains strong, as the number of Americans filing for unemployment benefits dipped below forecasts and the prior week’s report.
After the data, traders discounted a 50-basis-point (bps) rate cut by the Fed. Instead, they had priced in a 25 bps cut, with a slim chance that Powell and his colleagues would hold rates unchanged.
In the meantime, the St. Louis Fed President Alberto Musalem, one of the most hawkish members at the Federal Open Market Committee (FOMC), said that inflation is running close to 3%, with tariffs feeding through inflation.
Ahead this week, the US economic schedule will feature additional Fed speeches, Retail Sales for July, and the University of Michigan (UoM) Consumer Sentiment for August.
Daily digest market movers: Strong PPI boosts the Dollar, a headwind for Gold prices
- The US PPI rose 0.9% MoM in July after being flat in June. On an annual basis, PPI accelerated to 3.3% from 2.3%, well above the 2.5% forecast. Core PPI — which feeds into the Fed’s preferred inflation gauge, the Personal Consumption Expenditures (PCE) Price Index — soared 3.7% YoY, up sharply from 2.6% in the prior month, underscoring that companies will likely pass higher tariff-related costs on to consumers.
- Other data showed that Initial Jobless Claims for the week ending August 9 fell to 224,000, better than expectations of 228,000 and down from 226,000 the previous week. Continuing Claims rose to 1.953 million from 1.964 million, tempering concerns of a cooling jobs market.
- Now that inflation data on the producer and consumer sides are out, investors have turned cautious regarding the path of interest rates in the US. Friday’s Retail Sales data would be of interest to know the strength of the economy. A higher reading, and the markets could take a Fed rate cut at the September meeting off the table.
- The US Dollar Index (DXY), which tracks the performance of the buck’s value against a basket of its peers, surges over 0.47% at 98.24. The recovery of the Dollar has pushed Gold’s prices lower beneath $3,340.
- The US 10-year Treasury note yield surges five basis points to 4.289%.
- Traders have priced in a 92% chance of a 25 bps rate cut at the September meeting, according to Prime Market Terminal data.

Technical outlook: Gold price dips but remains bullish above $3,300
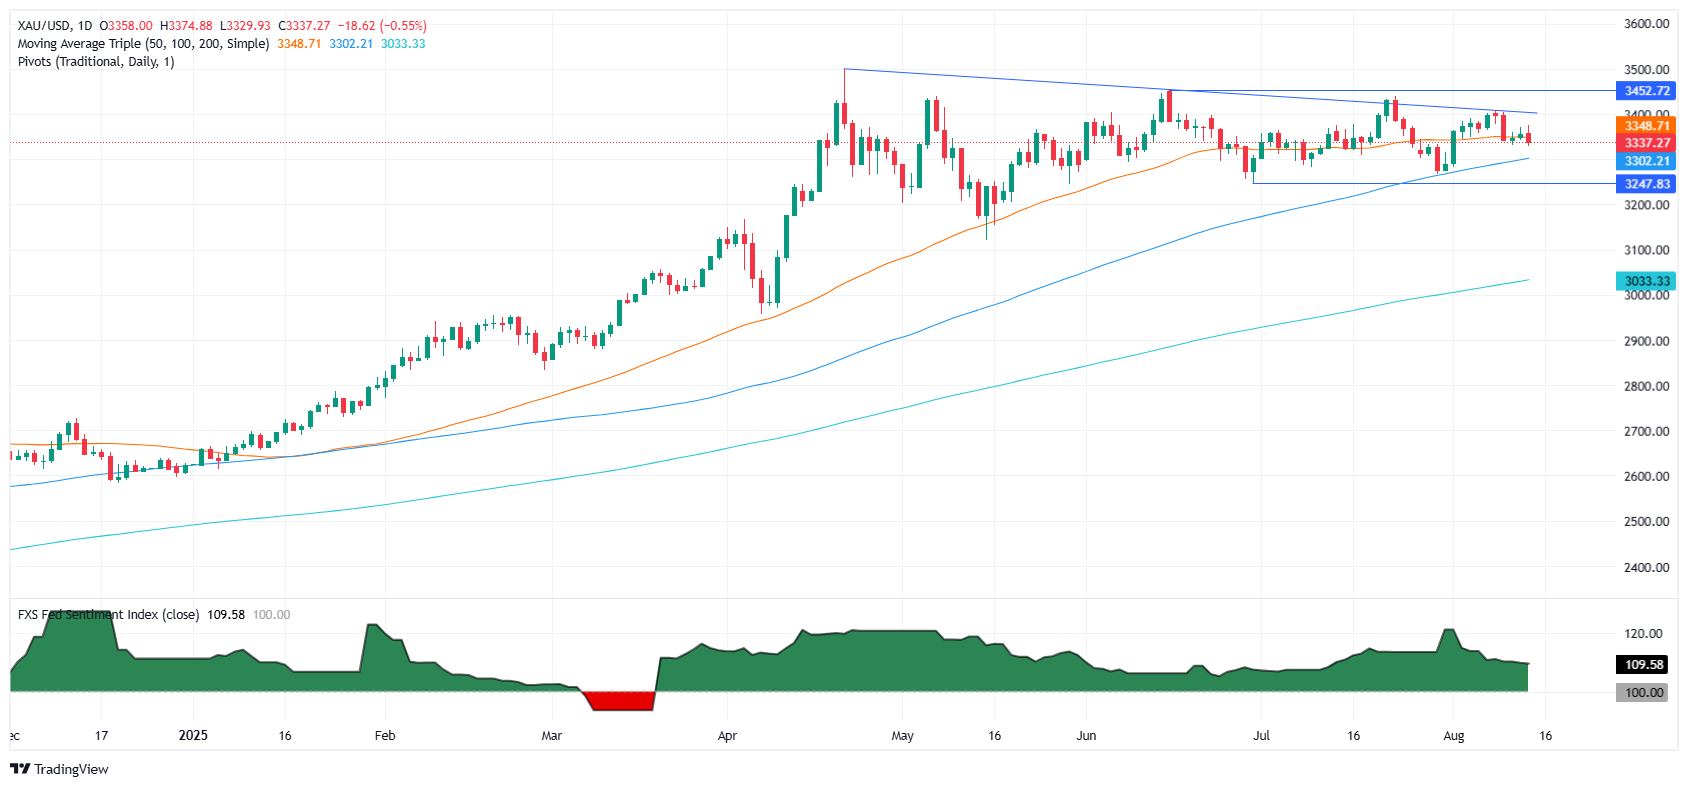
Gold price slips below $3,350 as factory gate prices in the States reignited fears of a reacceleration of inflation. The XAU/USD dipped below the confluence of the 20-day and 50-day Simple Moving Averages (SMAs) near the $3,349-$3,357 range. In the short term, momentum has turned bearish as depicted by the Relative Strength Index (RSI), but from a price action standpoint, Bullion should turn sideways below the July 31 low of $3,274.
If Gold clears $3,300, the next support would be the 100-day SMA at $3,292. Once surpassed, further downside lies below $3,274 as sellers eye $3,250.
On the other hand, if Bullion clears $3,357, the next resistance would be $3,380, followed by $3,400. Key resistance levels lie overhead, like the June 16 high at $3,452, followed by the record high of $3,500.

Gold FAQs
Gold has played a key role in human’s history as it has been widely used as a store of value and medium of exchange. Currently, apart from its shine and usage for jewelry, the precious metal is widely seen as a safe-haven asset, meaning that it is considered a good investment during turbulent times. Gold is also widely seen as a hedge against inflation and against depreciating currencies as it doesn’t rely on any specific issuer or government.
Central banks are the biggest Gold holders. In their aim to support their currencies in turbulent times, central banks tend to diversify their reserves and buy Gold to improve the perceived strength of the economy and the currency. High Gold reserves can be a source of trust for a country’s solvency. Central banks added 1,136 tonnes of Gold worth around $70 billion to their reserves in 2022, according to data from the World Gold Council. This is the highest yearly purchase since records began. Central banks from emerging economies such as China, India and Turkey are quickly increasing their Gold reserves.
Gold has an inverse correlation with the US Dollar and US Treasuries, which are both major reserve and safe-haven assets. When the Dollar depreciates, Gold tends to rise, enabling investors and central banks to diversify their assets in turbulent times. Gold is also inversely correlated with risk assets. A rally in the stock market tends to weaken Gold price, while sell-offs in riskier markets tend to favor the precious metal.
The price can move due to a wide range of factors. Geopolitical instability or fears of a deep recession can quickly make Gold price escalate due to its safe-haven status. As a yield-less asset, Gold tends to rise with lower interest rates, while higher cost of money usually weighs down on the yellow metal. Still, most moves depend on how the US Dollar (USD) behaves as the asset is priced in dollars (XAU/USD). A strong Dollar tends to keep the price of Gold controlled, whereas a weaker Dollar is likely to push Gold prices up.

