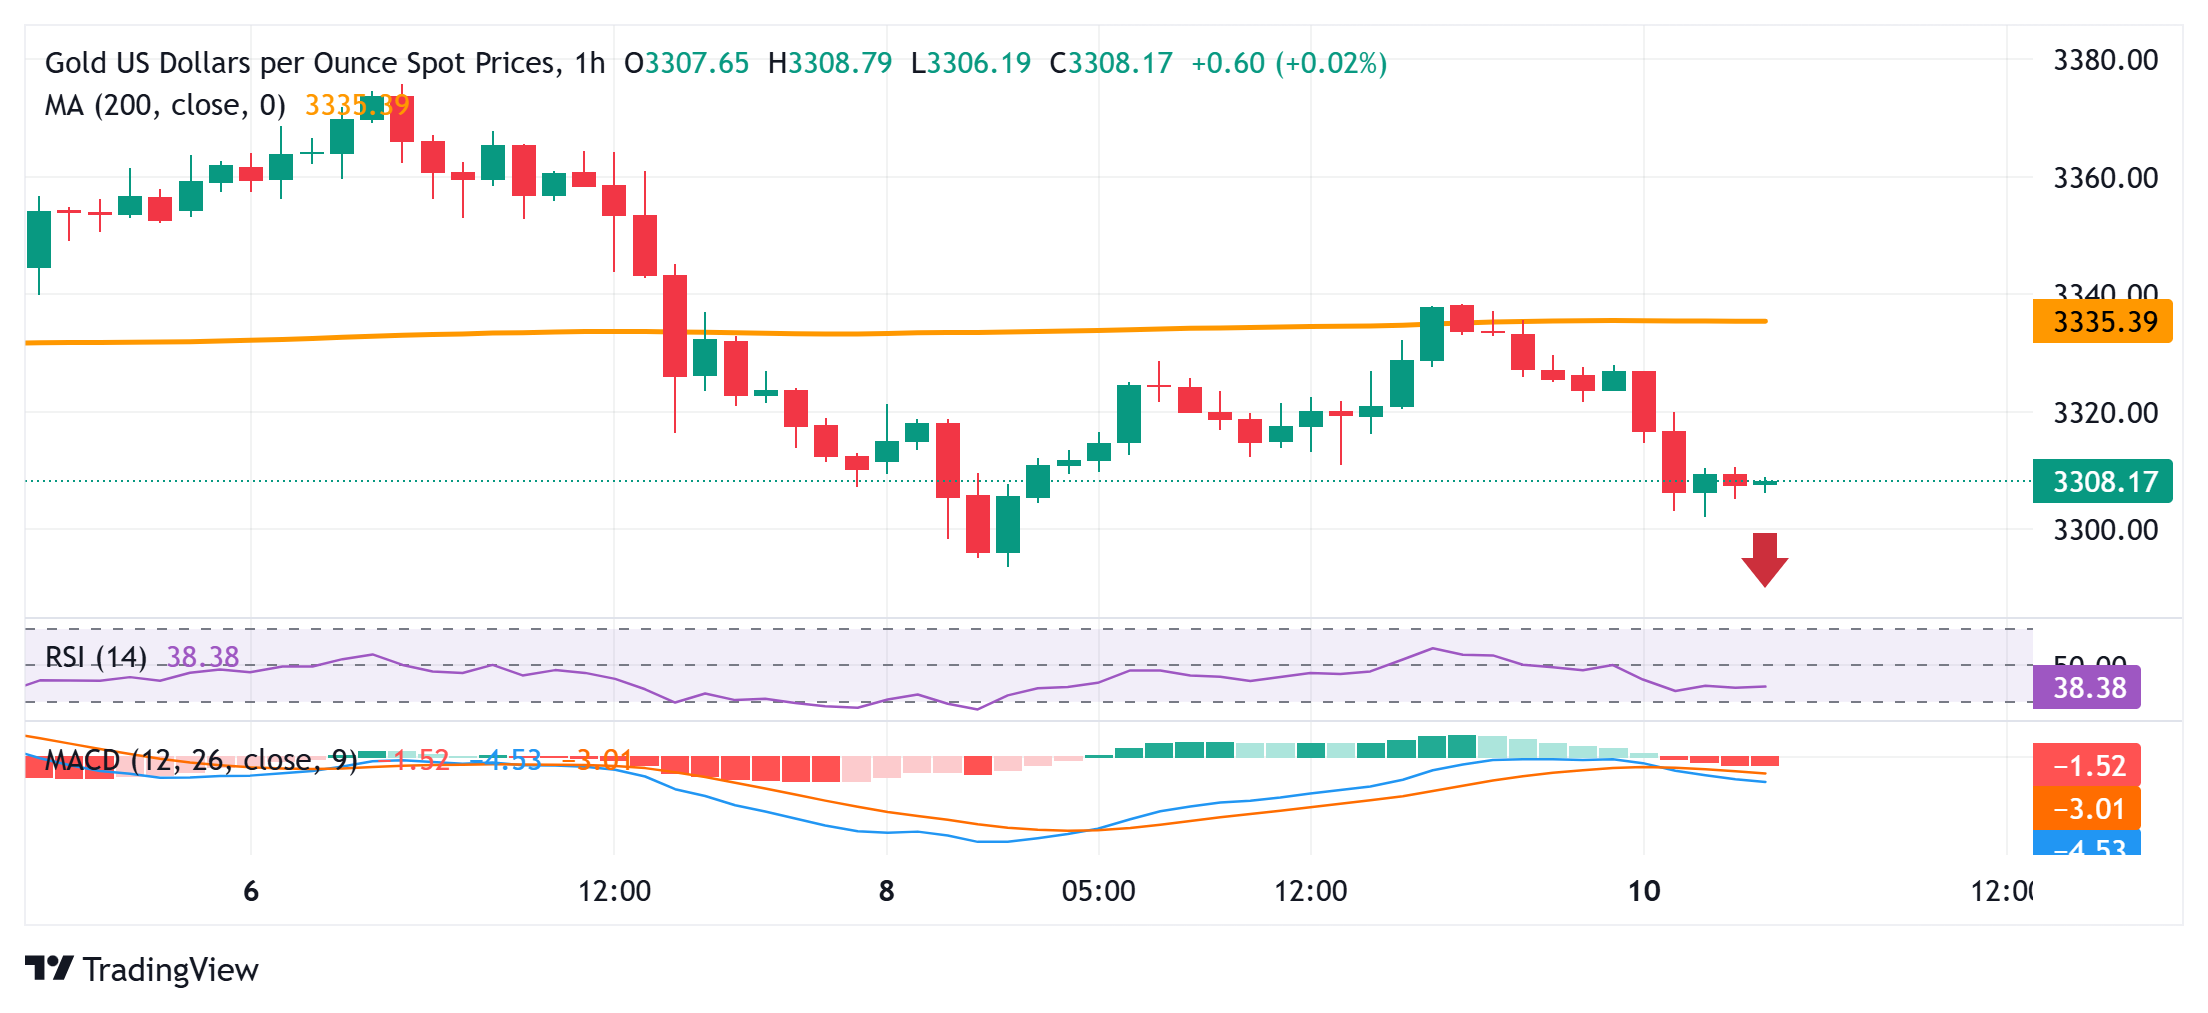
- Gold price struggles to capitalize on the previous day’s bounce from a one-week trough.
- The emergence of some USD buying and trade optimism weighed on the XAU/USD pair.
- Fed rate cut bets, US fiscal concerns, and geopolitical risks could support the commodity.
Gold price (XAU/USD) attracts fresh sellers during the Asian session on Tuesday and drops to the $3,300 neighborhood in the last hour, closer to a one-week low touched the previous day. The optimism over US-China trade talks undermines safe-haven assets, which, along with a goodish pickup in the US Dollar (USD) demand, turn out to be key factors exerting downward pressure on the bullion.
However, the growing acceptance that the Federal Reserve (Fed) will lower borrowing costs further in 2025 might keep a lid on any meaningful USD appreciation. Furthermore, persistent geopolitical risks stemming from the protracted Russia-Ukraine war and conflicts in the Middle East should help limit losses for the Gold price. This warrants caution for the XAU/USD bears ahead of US inflation figures.
Daily Digest Market Movers: Gold price is pressured by receding safe-haven demand and a stronger USD
- Chinese and US officials extend the new round of trade talks in London to a second day on Tuesday, fueling hopes for a deal between the world’s two largest economies. This remains supportive of a generally positive risk tone and prompts fresh selling around the safe-haven Gold price during the Asian session on Tuesday.
- A stronger-than-expected US Nonfarm Payrolls (NFP) report released on Friday dampened hopes for imminent interest rate cuts by the Federal Reserve this year. This assists the US Dollar to regain positive traction and turns out to be another factor that contributes to driving flows away from the non-yielding yellow metal.
- However, the CME Group’s FedWatch Tool indicates that traders are still pricing in a nearly 60% chance that the US central bank will cut interest rates at its September monetary policy meeting. This, along with concerns about the US government’s financial health, fails to assist the USD to capitalize on its intraday move higher.
- On the geopolitical front, Russia launched a massive airstrike on Ukraine and fired nearly 500 drones and missiles. This marks a further escalation of the conflict in the three-year-old war and might hold back the XAU/USD bears from placing aggressive bets in the absence of any relevant market-moving economic data from the US.
- The US Consumer Price Index (CPI) and the Producer Price Index (PPI) are due for release on Wednesday and Thursday, respectively. The crucial inflation figures should provide some cues about the Fed’s future rate-cut path, which, in turn, will drive the USD demand and provide some meaningful impetus to the commodity.
Gold price needs to find acceptance below $3,300 for bears to seize short-term control

From a technical perspective, the overnight failure to find acceptance above the 200-hour Simple Moving Average (SMA) and the subsequent slide favors the XAU/USD bears. Moreover, oscillators on hourly charts have been gaining negative traction and back the case for further intraday losses. Some follow-through selling below the $3,294-3,293 area, or the overnight swing low, will reaffirm the bearish outlook and make the Gold price vulnerable to accelerate the fall towards the $3,246-3,245 area (May 29 swing low) en route to the $3,200 neighborhood.
On the flip side, the 100-hour SMA, currently pegged near the $3,333-3.334 area might continue to act as an immediate hurdle. A sustained strength beyond could trigger an intraday short-covering move and lift the Gold price to the $3.352-3,353 hurdle. The momentum could extend further towards the $3,377-3,378 resistance, which if cleared should allow the XAU/USD to make a fresh attempt to conquer the $3,400 round figure.
US Dollar PRICE Today
The table below shows the percentage change of US Dollar (USD) against listed major currencies today. US Dollar was the strongest against the Euro.
| USD | EUR | GBP | JPY | CAD | AUD | NZD | CHF | |
|---|---|---|---|---|---|---|---|---|
| USD | 0.26% | 0.12% | 0.25% | 0.04% | -0.08% | -0.03% | 0.12% | |
| EUR | -0.26% | -0.12% | -0.03% | -0.18% | -0.32% | -0.29% | -0.11% | |
| GBP | -0.12% | 0.12% | 0.04% | -0.06% | -0.19% | -0.17% | 0.02% | |
| JPY | -0.25% | 0.03% | -0.04% | -0.16% | -0.35% | -0.35% | -0.19% | |
| CAD | -0.04% | 0.18% | 0.06% | 0.16% | -0.14% | -0.10% | 0.08% | |
| AUD | 0.08% | 0.32% | 0.19% | 0.35% | 0.14% | 0.05% | 0.21% | |
| NZD | 0.03% | 0.29% | 0.17% | 0.35% | 0.10% | -0.05% | 0.19% | |
| CHF | -0.12% | 0.11% | -0.02% | 0.19% | -0.08% | -0.21% | -0.19% |
The heat map shows percentage changes of major currencies against each other. The base currency is picked from the left column, while the quote currency is picked from the top row. For example, if you pick the US Dollar from the left column and move along the horizontal line to the Japanese Yen, the percentage change displayed in the box will represent USD (base)/JPY (quote).

