- Gold trades near $3,350 on Tuesday, extending losses after Monday’s 1.6% drop to its lowest level in a week.
- Monday’s sell-off was driven by optimism over potential Russia-Ukraine peace talks.
- US July CPI rose 0.2% MoM, matching forecasts, while the annual rate held at 2.7%, slightly below expectations of 2.8%. Core CPI climbed 0.3% MoM and 3.1% YoY, both above estimates.
Gold (XAU/USD) steadies on Tuesday after slipping to a fresh one-week low. At the time of writing, the precious metal is trading near $3,350 during American hours, recovering modestly after marking an intraday low of $3,331, pressured by rising US Treasury yields and a risk-on sentiment in global markets, which are offsetting support from a softer Greenback after the release of the latest US inflation data.
Data from the US Bureau of Labor Statistics showed headline Consumer Price Index (CPI) rose 0.2% MoM in July, matching expectations and slowing from June’s 0.3% gain. On an annual basis, consumer prices held steady at 2.7%, slightly below forecasts of 2.8%. In contrast, Core CPI — which excludes volatile food and energy prices — increased 0.3% MoM, above the expected 0.2% and June’s 0.2%. The annual core reading climbed to 3.1% from 3.0%, also exceeding market estimates.
The metal showed signs of stabilization after US President Donald Trump announced on Monday, via his social media platform Truth Social, that Gold imports would be exempt from new US tariffs.
The proposed tariffs could have applied to widely traded Swiss Gold bars, including 1-kilogram and 100-ounce bars, creating uncertainty in the bullion market and raising concerns over potential supply chain disruptions. The clarification eased market jitters, but investors are still awaiting a formal executive order to definitively clarify the administration’s tariff policy.
Market movers: CPI in focus as US-China tariff truce eases tensions
- On Monday, Gold prices dropped more than $50 — about 1.6% — to just over $3,340 per troy ounce. The fall came after markets reacted to hopes for progress in easing Russia-Ukraine tensions. US President Donald Trump will meet Russian President Vladimir Putin in Alaska on Friday to negotiate an end to the war in Ukraine.
- A softer US Dollar is offering modest support to the precious metal. The US Dollar Index (DXY), which tracks the Greenback’s value against a basket of six major currencies, is trading near its two-week low around 98.30.
- • U.S. Treasury yields climbed to a one-week high after the CPI release, with the benchmark 10-year note yielding around 4.297% and the 30-year yeild near 4.885%.
- According to the CME FedWatch Tool, markets are now pricing in a 94% probability of a 25 basis point move in September, up from 84% earlier in the day as the latest CPI report bolstered expectations of a Fed rate cut next month.
- After the CPI release, the US Dollar came under fresh selling pressure, compounded by comments from President Donald Trump on Truth Social stating he is considering allowing a major lawsuit against Fed Chair Jerome Powell, adding he “would sue Powell over construction of Fed buildings.”
- On the trade front, sentiment improved after US President Donald Trump signed an order extending the US-China tariff truce by another 90 days, moving the next review to November 9. This delay eases pressure on global supply chains and calms near-term trade tensions. Still, traders are cautious, viewing the move as a short pause rather than real progress toward ending the trade dispute.
- Looking ahead, remarks from Fed officials Thomas Barkin and Jeffrey Schmid later on Tuesday will be in focus for any policy hints. The US economic calendar will feature the Producer Price Index (PPI) on Thursday, followed by Retail Sales and the preliminary August reading of the Michigan Consumer Sentiment Index on Friday. These releases will be closely monitored for further signals on inflation trends and could play a key role in shaping expectations for a potential rate cut in September.
Technical analysis: XAU/USD holds below key moving averages ahead of CPI

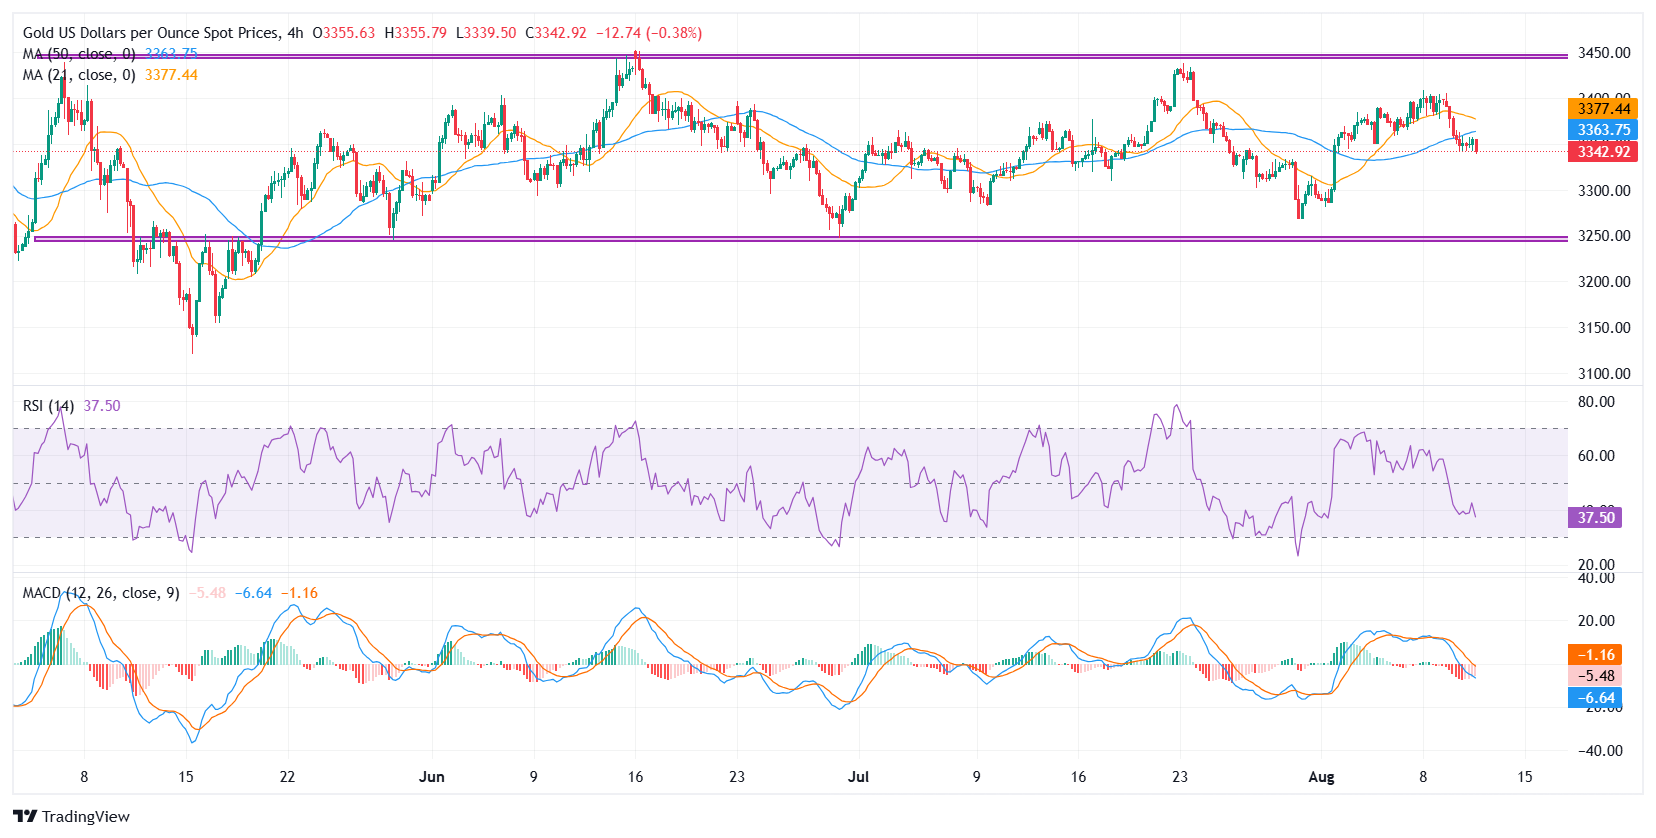
Gold (XAU/USD) has been consolidating in a well-defined horizontal range between $3,450 and $3,250 since mid-April, after peaking at an all-time high of $3,500 earlier that month.
Price action on the 4-hour chart shows repeated failures to sustain gains above the $3,400 psychological barrier, with the most recent rejection last week reinforcing this level as a strong supply zone.
The 21-period SMA ($3,377) has begun to slope lower and is showing early signs of converging with the 50-period SMA ($3,363), reflecting waning upside momentum. With price trading below both moving averages, the short-term bias remains tilted to the downside unless a soft US CPI print sparks a rebound.
The Relative Strength Index (RSI) is hovering around 37, pointing to growing downside momentum but not yet in oversold territory, leaving room for further declines. The Moving Average Convergence Divergence (MACD) indicator remains in negative territory, with both the MACD line and signal line below zero, accompanied by a bearish crossover, confirming the momentum shift toward sellers.
Immediate resistance is seen at $3,363 (50-SMA), followed by $3,377 (21-SMA) and the $3,400 psychological barrier. On the downside, initial support lies at $3,330-$3,320, with a break below exposing the range floor at $3,250. Further weakness could bring the next major support at $3,000 into focus.
Economic Indicator
Consumer Price Index (YoY)
Inflationary or deflationary tendencies are measured by periodically summing the prices of a basket of representative goods and services and presenting the data as The Consumer Price Index (CPI). CPI data is compiled on a monthly basis and released by the US Department of Labor Statistics. The YoY reading compares the prices of goods in the reference month to the same month a year earlier.The CPI is a key indicator to measure inflation and changes in purchasing trends. Generally speaking, a high reading is seen as bullish for the US Dollar (USD), while a low reading is seen as bearish.
Read more.

