- The United States and China reach a provisional trade agreement following London talks, which limits Gold’s strength amid easing safe-haven demand.
- The US Consumer Price Index data for May is expected to reflect rising inflation.
- The release of CPI shapes the Fed’s interest rate expectations, providing a direct threat to Gold.
Gold (XAU/USD) is trading higher during the European session on Wednesday as investors adopt a cautious stance ahead of key US inflation data. The precious metal gains modest ground, hovering above $3,330 at the time of writing.
Market participants are closely watching the upcoming May US Consumer Price Index (CPI) release on Wednesday, which is expected to provide critical insight into inflation dynamics and Federal Reserve (Fed) monetary policy.
Consensus forecasts suggest that US headline inflation accelerated to an annual rate of 2.5% in May, up from the 2.3% increase seen in April. During the same period, core CPI inflation, which excludes the volatile food and energy prices, is expected to tick up to 2.9% from 2.8%.
Rising inflation and the prospect of higher interest rates by the Fed typically support the US Dollar (USD), weighing on non-yielding assets like Gold.
Gold daily digest market movers: XAU/USD driven by US-China trade deal and US CPI data
- The US and China reach a trade deal that includes the removal of China’s export restrictions on rare earths, which is likely to offer some relief for the US supply chain. These minerals are crucial for sectors such as technology, defense and green energy, where they are essential for products like semiconductors, electric vehicles (EVs) and military hardware.
- High-level negotiations between the two countries in London resulted in a provisional framework agreement, which now awaits a formal signature from US President Donald Trump and Chinese President Xi Jinping.
- On the other hand, Trump received a favorable development on Tuesday after a federal appeals court ruled that his “Liberation Day” tariffs can remain in effect, for now. The decision temporarily overturns a lower court ruling from last month, in which the US Court of International Trade blocked the levies, citing procedural violations in how they were enacted.
- Regarding US inflation data, the CPI and the core CPI are projected to rise by 0.2% and 0.3%, respectively, on a monthly basis.
- On Thursday, the US will release the US Producer Price Index (PPI) data for May, which is expected also to show an increase in headline inflation from a producer level.
- These figures are likely to influence market expectations regarding the Fed policy path. The Fed left the federal funds rate unchanged at the 4.25%–4.50 % range at its May meeting, but policymakers have signaled that their decisions remain data-dependent.
- According to the CME FedWatch Tool, market participants expect the Fed to keep interest rates unchanged at the June and July meetings, with a 52.2% probability of an interest rate cut priced in for September.
Gold technical analysis: XAU/USD flirts with $3,300 – Is a potential breakout near?
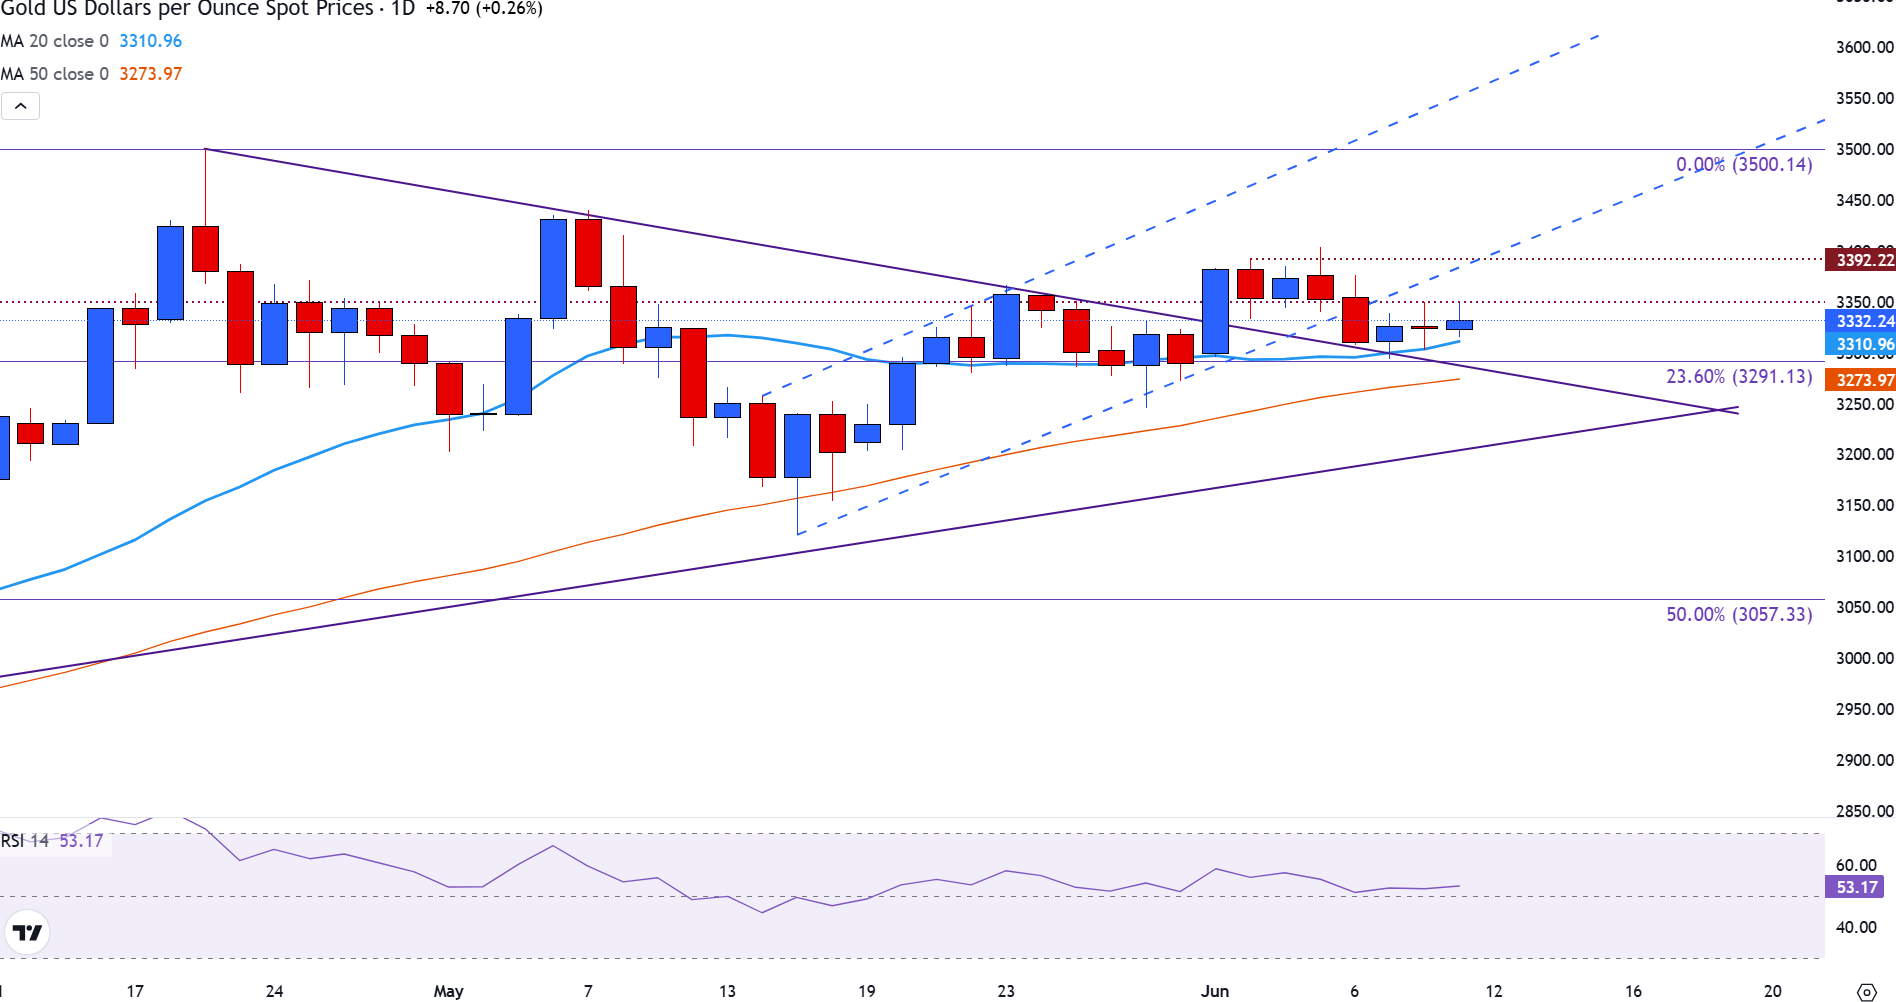
Gold price is currently holding above the $3,300 mark, hovering around $3,330 at the time of writing, as the market finds short-term support in this range.
On the upside, resistance is forming near the psychological level of $3,350, and a break above this barrier could pave the way for a move toward Friday’s high of around $3,375.
Further up, the $3,400 psychological level limited the bullish potential last week. If buyers clear this zone and bullish momentum gains traction, a move toward the April all-time high at $3,500 may be possible.

However, the Relative Strength Index (RSI) indicator flattens near the neutral zone of 50 on the daily chart, signalling a lack of momentum and indecision among traders.
In the event of a downside move, the immediate support for the Gold price is at the 20-day Simple Moving Average (SMA) at $3,310, just above the next psychological support zone of the $3,300 mark, and ahead of the 23.6% Fibonacci retracement level of the January-April rise at $3,291.
Further down, the 50-day SMA could then provide an additional layer of support around $3,275, while the tip of a symmetrical triangle chart pattern could provide another important cushion for downside price action at $3,240.
Economic Indicator
Consumer Price Index (YoY)
Inflationary or deflationary tendencies are measured by periodically summing the prices of a basket of representative goods and services and presenting the data as The Consumer Price Index (CPI). CPI data is compiled on a monthly basis and released by the US Department of Labor Statistics. The YoY reading compares the prices of goods in the reference month to the same month a year earlier.The CPI is a key indicator to measure inflation and changes in purchasing trends. Generally speaking, a high reading is seen as bullish for the US Dollar (USD), while a low reading is seen as bearish.
Read more.

