Bullish view
- Buy the AUD/USD pair and set a take-profit at 0.6600.
- Add a stop-loss at 0.6350.
- Timeline: 1-2 days.
Bearish view
- Sell the AUD/USD pair and set a take-profit at 0.6350.
- Add a stop-loss at 0.6600.

The AUD/USD exchange rate was flat after the US reached a deal with China and after the Bureau of Labor Statistics (BLS) released the latest consumer inflation data. The pair was trading at the psychological point at 0.6500, where it has remained in the past few weeks.
US Inflation Data Ahead
The AUD/USD pair moved sideways ahead of the upcoming US producer price index (PPI), which will come out today, June 12.
The PPI inflation figure looks at the average change of the selling prices received by domestic producers for their goods and services. It is a common measure that looks at whether their prices are rising or not.
Economists polled by Reuters expect the data to show that the headline PPI rose from 2.4% in April to 2.6%. Core PPI, which excludes the volatile items, is expected to come in at 0.3%, an increase from the previous drop of 0.4%.
These numbers comes a day after the Bureau of Labor Statistics showed that the headline consumer price index rose by a small margin than expected. The CPI rose from 2.3% to 2.4%, lower than the consensus estimate of 2.5%.
The core CPI figure remained at 2.8% in May, even as companies started to adjust their prices to Donald Trump’s tariffs As such, Trump and JD Vance continued to pressure the Fed to slash interest rates. Trump is recommending a full percentage point cut.
The AUD/USD pair also reacted to this week’s trade negotiations between the US and China in London. The two sides reached a truce, with China pledging to resume rare earth materials shipments to the US.
AUD/USD technical analysis
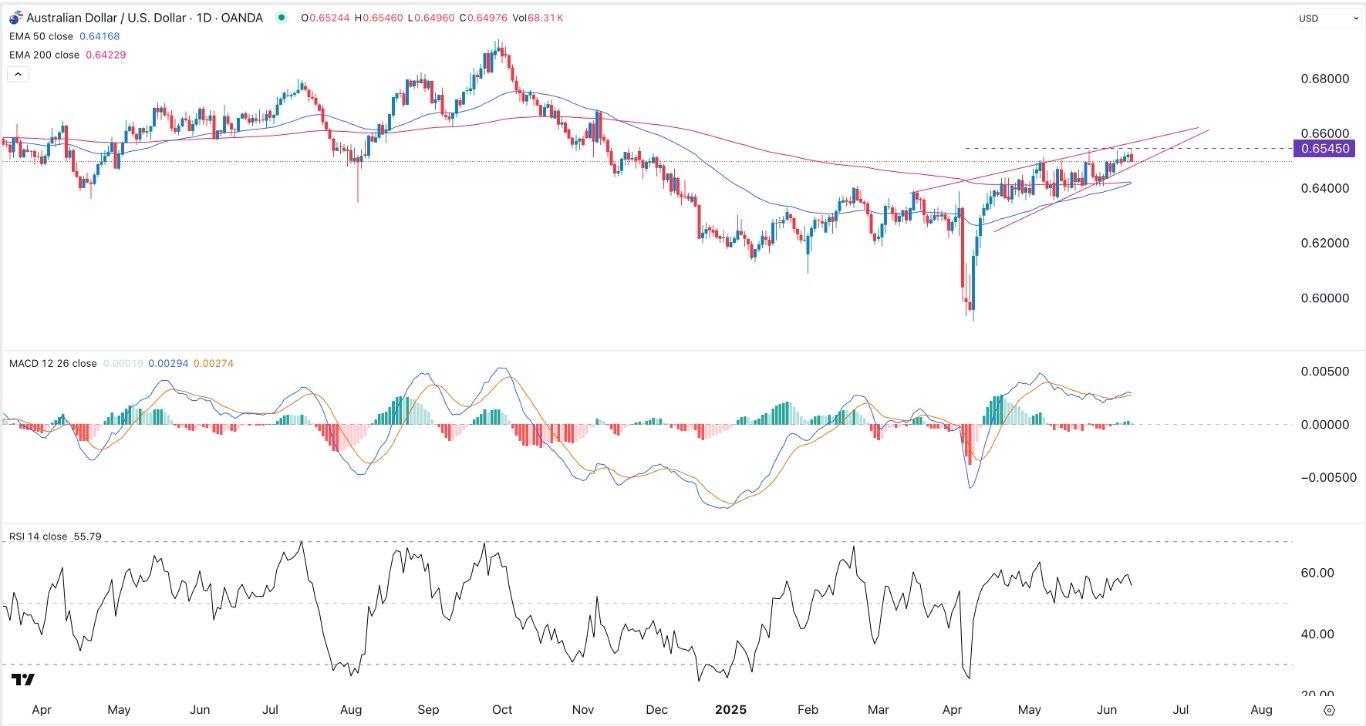
The daily chart shows that the AUD/USD exchange rate has moved upwards in the past few days. It rose to the psychological point at 0.6500, a range it has remained at in the past few days.
On the positive side, the pair is about to form a golden cross pattern as the 50-day and 200-day moving averages are nearing their crossover. A golden cross is one of the most bullish patterns in technical analysis.
The risk, however, is that it has formed a rising wedge pattern, pointing to an eventual pullback, potentially to the psychological point at 0.6400. A move above the resistance at 0.6600 will invalidate the bearish outlook.
Ready to trade our free trading signals? We’ve made a list of the top forex brokers in Australia for you to check out.
Crispus Nyaga is a financial analyst, coach, and trader with more than 8 years in the industry. He has worked for leading companies like ATFX, easyMarkets, and OctaFx. Further, he has published widely in platforms like SeekingAlpha, Investing Cube, Capital.com, and Invezz. In his free time, he likes watching golf and spending time with his wife and child.
