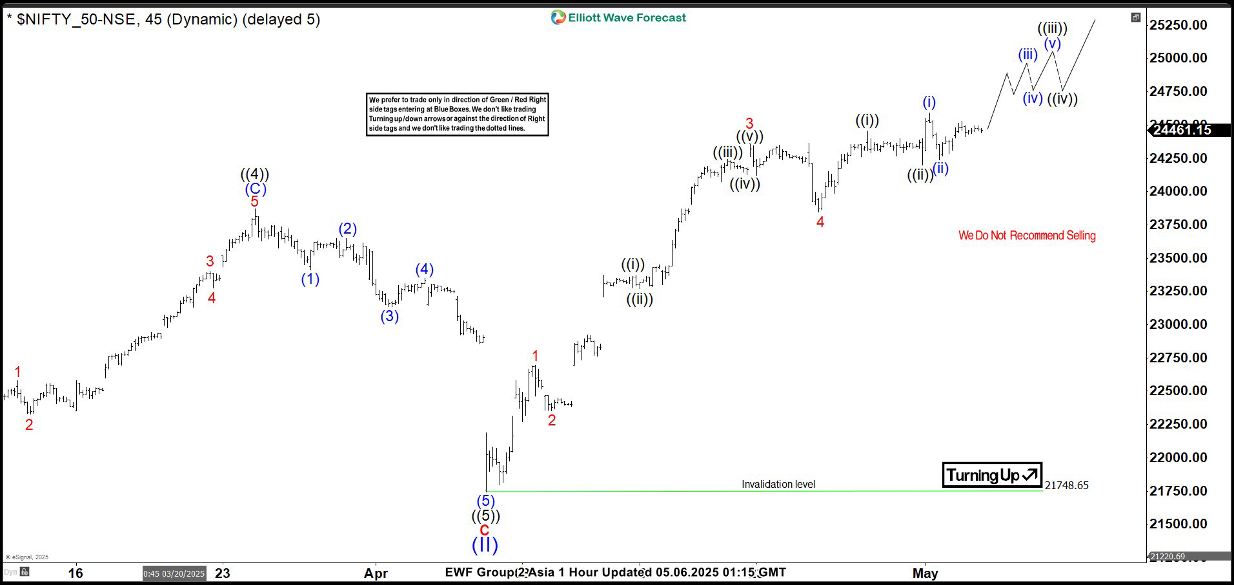
The Nifty Index has staged a notable recovery after a selloff that began on September 27, 2024, from a high of 21,748.65. We label this decline as wave (II), and the index has since turned upward. However, to confirm that the correction is over and avoid a potential double correction, the index must break above its previous peak of 26,277.35. The rally from the wave (II) low is expected to unfold as a five-wave impulse structure, a pattern commonly analyzed in Elliott Wave theory.
Starting from the wave (II) low, the first wave (wave 1) peaked at 22,697.2, followed by a pullback in wave 2 that bottomed at 22,353.25. The index then surged in wave 3, which itself subdivided into a smaller impulsive structure. Within wave 3, the first sub-wave ((i)) reached 23,372.75, followed by a dip in wave ((ii)) to 23,273.05. The third sub-wave ((iii)) climbed to 24,242.6, with a brief pullback in wave ((iv)) to 24,126.95. The final sub-wave ((v)) concluded at 24,359.3, completing wave 3. A subsequent wave 4 pullback found support at 23,847.85.
Currently, the index may achieve a few more highs, but the rally from the April 7, 2025, low appears mature and could soon face a three-wave correction. As long as the key support at 21,748.65 holds, any near-term pullbacks should find support in a 3, 7, or 11-swing pattern, setting the stage for further upside.
Nifty 45 minute Elliott Wave chart

Nifty Elliott Wave [Video]

