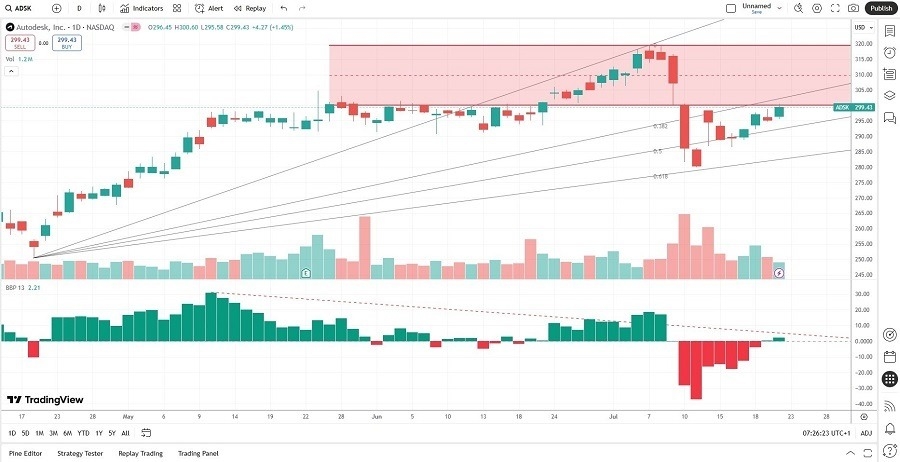
Short Trade Idea
Enter your short position between 294.81 (the intra-day low of its last bearish candle) and 307.27 (the close of a bearish candle marking the lower band of its horizontal resistance zone).
Market Index Analysis
- Autodesk (ADSK) is a member of the NASDAQ 100 and the S&P 500.
- Both indices are near record highs with technical cracks flashing warning signals.
- The Bull Bear Power Indicator of the NASDAQ 100 shows a negative divergence.
Market Sentiment Analysis
Futures suggest more volatility ahead after US President Trump announced a trade deal with Japan and tariffs of 15%. He also announced a trade deal with the Philippines, but Manila has not confirmed anything. Earnings will drive market sentiment, and the AI craze is dominant, but investors should not ignore the non-AI sector, where economic red flags suggest uncertainty. Today’s trading session might offer little direction, as investors await earnings from Alphabet and Tesla after the bell.
Autodesk Fundamental Analysis
Autodesk is a multinational software company best known for AutoCAD, a computer-aided design software used by architects, engineers, and designers to design and construct models of buildings and structures.
So, why am I bearish on ADSK despite its most recent bounce?
Autodesk shares remain overvalued, and the economic uncertainty casts a long shadow. ADSK has decent long-term potential, but the current environment suggests a correction. The rumored PTC acquisition, which Autodesk ruled out, might be the first sign of more troubles ahead. The price-to-book ratio confirms excessive valuations, and the current share price reflects all medium-term positive catalysts.

The price-to-earnings (P/E) ratio of 64.26 makes ADSK an expensive stock. By comparison, the P/E ratio for the NASDAQ 100 is 41.26.
The average analyst price target for ADSK is 339.54. It suggests good upside potential, but I don’t see the share price reaching it. Also, the risk of downgrades persists.
Autodesk Technical Analysis
Today’s ADSK Signal
- The ADSK D1 chart shows price action just beneath its horizontal resistance zone.
- It also shows the ascending 38.2% Fibonacci Retracement Fan level as its next resistance level.
- The Bull Bear Power Indicator turned bullish, but the risks of a reversal initiated by its descending trendline have risen.
- Trading volumes are notably higher during selloffs than during rallies.
- ADSK corrected as the SNASDAQ 100 rallied to fresh highs, a significant bearish development.
My Call
I am taking a short position in ADSK between 294.81 and 307.27. The high valuations and balance sheet issues are fundamental bearish signs. The rise in selling volumes versus buying volumes magnifies the bearish signals. Therefore, I see the current advance as a bearish bounce.
- ADSK Entry Level: Between 294.81 and 307.27
- ADSK Take Profit: Between 250.46 and 263.58
- ADSK Stop Loss: Between 313.81 and 326.62
- Risk/Reward Ratio: 2.33
Ready to trade our daily signals? Here is our list of the best brokers for trading worth checking out.
