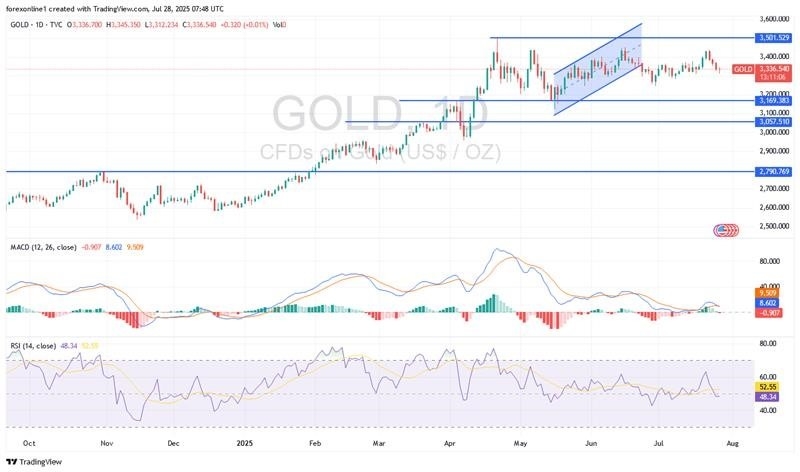
Today’s Gold Analysis Overview:
- The overall Gold Trend: Undergoing profit-taking sales.
- Today’s Gold Support Levels: $3310 – $3280 – $3240 per ounce.
- Today’s Gold Resistance Levels: $3355 – $3370 – $3410 per ounce.

Today’s Gold Trading Signals:
- Sell gold from the resistance level of $3370 with a target of $3270 and a stop loss of $3400.
- Buy gold from the support level of $3290 with a target of $3400 and a stop loss of $3250.
Technical Analysis of Gold Price (XAU/USD) Today:
The recovery of the US dollar at the start of this week, ahead of key US jobs data and the Federal Reserve’s policy announcement, has contributed to renewed selling pressure on gold. Gold prices fell from the $3345 per ounce resistance to the $3312 per ounce support level before bouncing back to $3336 per ounce at the time of writing. According to gold trading platforms, the yellow metal’s prices declined amid positive investor sentiment following the announcement of the trade agreement between the United States and the European Union.
This agreement imposes a 15% tariff on most European goods—including automobiles and computer chips—while the EU commits to purchasing $750 billion in US energy and additional military equipment. Meanwhile, US and Chinese negotiators are scheduled to meet later today in an effort to extend the current trade truce and prevent new tariffs.
Also, investors are focused on the Federal Reserve’s policy announcement scheduled for Wednesday, looking for clues on future US interest rate moves. Adding to the market’s cautious tone is a busy economic calendar featuring key US labor data such as nonfarm payrolls, ADP employment, and JOLTS job openings. The PCE (Personal Consumption Expenditures) price index will also be closely watched for signs that tariffs might be driving inflationary pressures.
Gold Trading Scenarios:
Bearish Scenario: According to the daily timeframe chart, and potentially with a no-deposit bonus, selling pressure on the gold price index could intensify if bears successfully push below the $3300 per ounce level. This is a significant area that bears see as a pathway to test the $3250 per ounce support, which was the support area at the end of last month. Currently, the 14-day RSI (Relative Strength Index) is below the midline, supporting the bears’ momentum, and the MACD (Moving Average Convergence Divergence) lines are starting to turn downward.
Trading Tips:
Traders are advised to employ a strategy of buying gold on every price dip, with a breakout above the $3290 support representing the most suitable initial buying opportunity currently.
Bullish Scenario: Over the same daily timeframe, and according to gold analysts’ forecasts, the $3400 per ounce resistance will remain important for a strong bullish control, thereby preparing for new record upward breakouts.
US Dollar Rises Ahead of Key Events:
According to forex currency market trading, the US Dollar Index (DXY), which measures the performance of the US currency against a basket of other major currencies, rose to 98 today, Monday, July 28, 2025. This is its highest level in nearly a week, supported by easing trade tensions following the newly announced US-EU trade agreement.
The agreement imposes a 15% tariff on EU exports to the United States, down from the 30% rate initially threatened by President Trump. In addition, US and Chinese officials are scheduled to meet today to discuss ongoing trade issues, with a widely expected extension of the current trade truce, which is set to expire on August 12.
Market focus is also on the Federal Reserve’s monetary policy decision later this week, although no changes to the federal funds rate are currently expected. A series of key economic indicators will also be released in the coming days, providing further insight into the US economy. These include GDP growth figures, US nonfarm payrolls, PCE inflation, and the ISM Manufacturing PMI, at a time when concerns about the economic impact of tariffs appear to be easing.
Will gold prices rise soon?
According to trading experts’ views, rising inflation and falling interest rates imply that US real yields are expected to decline before the end of the year, making US Treasury bonds less attractive. Meanwhile, gold shines in a low real yield environment, becoming an attractive diversification tool for portfolios given its lower opportunity costs as a non-yielding asset.
During last week’s trading, gold prices fluctuated significantly, leading to a split in the weekly gold price chart. Also, the latest weekly gold survey showed industry experts divided between bearish and neutral stances. Meanwhile, retail traders maintained renewed optimism about gold’s short-term outlook.
Ready to trade today’s Gold prediction? Here’s a list of some of the best XAU/USD brokers to check out.
