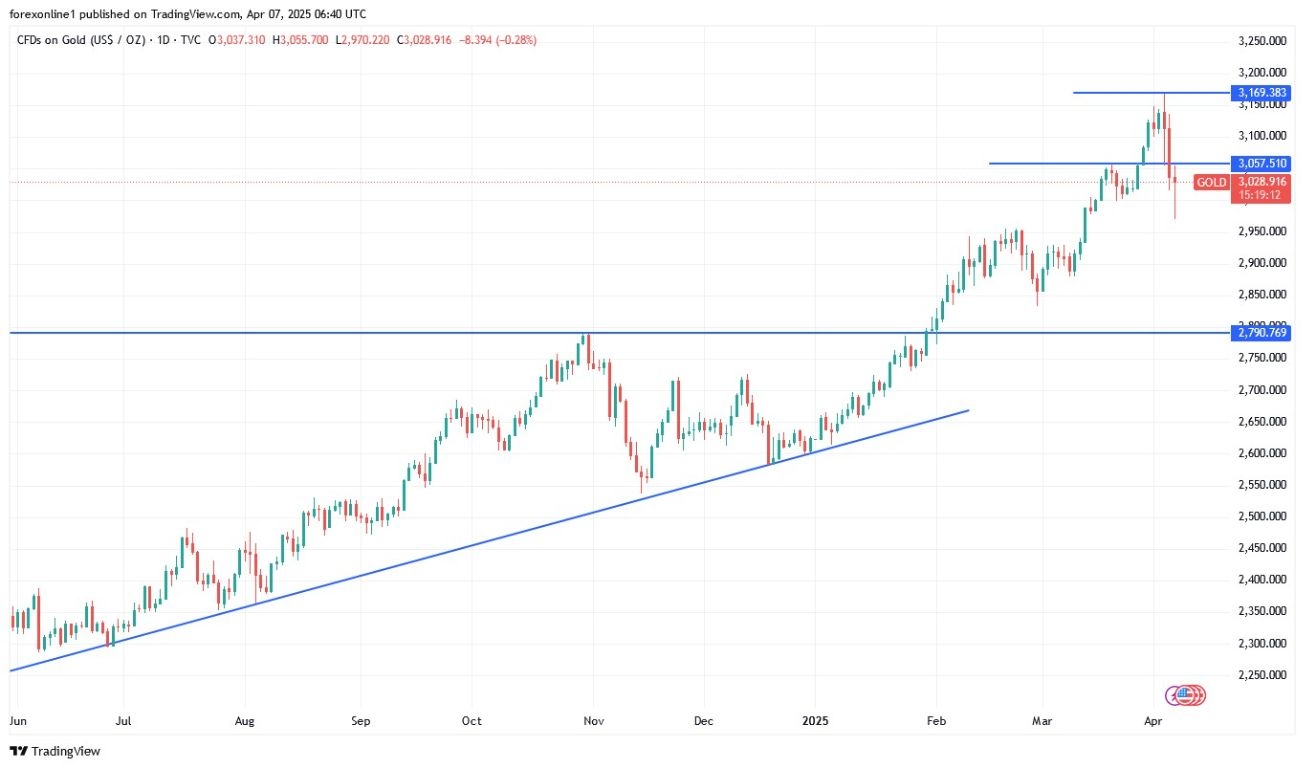
Today’s Gold Analysis Overview:
- Gold’s general trend: Up.
- Gold resistance points today: $3,025-$3,000.
- Gold resistance points today: $3,052-$3,080.
- Gold recommendation today: Buy at every lower level.

Gold Price Analysis (XAU/USD) Today
Amidst the financial market turmoil following the official implementation of Trump’s tariffs against major trading partners, in an event Trump described as “American Trade Liberation Day,” the gold price index retreated by more than 2.5 percent from its all-time high when it tested the $3167 per ounce resistance level. Losses extended to the $3016 per ounce support level before closing the week’s trading stable around $3037 per ounce… the same level at which spot gold prices will begin trading the week of US inflation data and the release of the US Federal Reserve meeting minutes. According to gold trading company platforms, the gold price plummeted to the $2970 per ounce support level, its lowest in three weeks, before stabilizing around $3030 per ounce at the time of writing.
Despite the profit-taking selloffs, which we often noted could occur at any time, today’s gold price trend remains upward as long as prices remain stable above the historical psychological resistance of $3000 per ounce. Remember that US stock markets suffered heavy losses, with the S&P 500 ending the week down 9%, its biggest loss since May 2020, while the gold price did not retreat by more than 2.5 percent.
Gold Price Forecasts for the Coming Period
According to today’s gold analysts’ forecasts, the spot gold price maintains a support level above $3000 per ounce, but analysts warn investors that there is room for further decline, as it may test a low support level of $2800 per ounce. Generally, according to forecasts, if the global trade war escalates, central banks may also take steps to diversify their investments away from the US dollar at a much faster pace. As a monetary metal, gold remains the biggest beneficiary of that environment.
Gold prices ended last week’s trading at a support level slightly above $3000 per ounce, ending a five-week winning streak. The latest spot contract prices reached $3023 per ounce, down 2% from last Friday, and the gold price also fell by about 4.5% from its all-time high recorded on Thursday night.
According to gold experts’ forecasts, although the gold sell-off was sharper than expected, this move is not surprising, as momentum indicators showed that prices were trading in an overbought area. However, they do not expect the rally to end, even if prices fall. According to forecasts, if the gold price finds some support around $3000 or even $2900 and stabilizes, it may reset the MACD indicator and provide a base for a new phase of the rally that has lasted for years.
Key Technical Support and Resistance Levels
- Nearest Support Levels for Gold Prices Today: $3015, $2985, $2950 per ounce.
- Nearest Resistance Levels for Gold Prices Today: $3055, $3080, $3160 per ounce.
Frequently Asked Questions
Is it possible to buy gold now?
There may be opportunities to buy below the $3000 level, and today it plummeted to the $2970 support, which was a buying opportunity, and from there and lower, buying is possible, but without risk.
Will gold prices rise today?
This may be possible if global geopolitical and trade tensions increase, along with the announcement of increased central bank purchases of gold bullion.
Ready to trade today’s Gold prediction? Here’s a list of some of the best XAU/USD brokers to check out.
