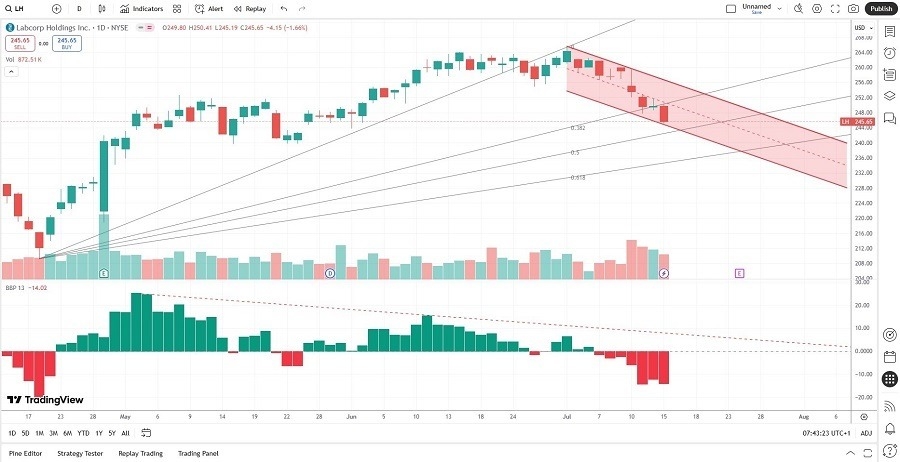
Declining profit margins and value destruction meet employee warnings over the quality of work. Rising challenges in the US healthcare system could derail profits. Is there more downside ahead for Labcorp after a cascade of technical breakdowns?
Short Trade Idea
Enter your short position between 243.71 (a horizontal support level) and 250.41 (yesterday’s intra-day high).
Market Index Analysis
- Labcorp (LH) is a member of the S&P 500.
- This index remains near a record high with rising bearish momentum.
- The Bull Bear Power Indicator of the S&P 500 shows a negative divergence.
Market Sentiment Analysis
Except for AI-related stocks, equity markets sold off yesterday, as investors received their first inflation data showing the impact of US President Trump’s tariffs. Today’s PPI data could magnify concerns and provide a reality check. The second quarter earnings season is off to a rocky start after big banks failed to impress. Trump’s crypto bills hit a roadblock in Congress, adding to downbeat sentiment. Futures suggest a continuation of yesterday’s mild pullback, which could accelerate after today’s PPI report and earnings releases.
Labcorp Fundamental Analysis
Labcorp operates in over 100 countries as one of the largest clinical laboratory networks globally. Still, it derives most of its business from the US. Labcorp has over 70,000 employees, processes over 160M tests annually, and receives over 10% of its revenues from Medicaid.
So, why am I bearish on LH at current levels?
Labcorp demands high valuations with contracting profit margins, while it destroys shareholder value. Last year’s class action lawsuit over patient records is a minor distraction, but changes to Medicaid could impact profitability. Another reason that worries me is the recent employee warnings about the quality of its work. The small dividend is less significant than its worsening debt-to-equity ratio in the current interest rate environment. I believe next week’s earnings release and outlook will drive its share price lower.
|
Metric |
Value |
Verdict |
|
PE Ratio |
28.33 |
Bearish |
|
PB Ratio |
2.48 |
Bearish |
|
PEG Ratio |
0.93 |
Bullish |
|
Current Ratio |
1.84 |
Bearish |
|
ROIC-WACC Ratio |
Negative |
Bearish |
Labcorp Fundamental Analysis Snapshot
The price-to-earning (PE) ratio of 28.33 makes LH an expensive stock. By comparison, the PE ratio for the S&P 500 is 28.93.
The average analyst price target for LH is 277.23. While it suggests upside potential, I believe downside revisions could follow its next earnings release.
Labcorp Technical Analysis
Today’s LH Signal

Labcorp Price Chart
- The LH D1 chart shows a bearish price channel, which could lead price action lower.
- It also shows a breakdown below the 38.2% Fibonacci Retracement Fan.
- The Bull Bear Power Indicator is bearish.
- The average trading volumes have increased during the most recent selloff.
- LH corrected as the S&P 500 rallied to fresh highs, a significant bearish development.
My Call
I am taking a short position in LH between 243.71 and 250.41. The bearish price channel should guide this company lower, and next week’s second-quarter earnings release could provide the next bearish catalyst. The increase in trading volumes confirms bearish sentiment, and LH will struggle in a broader market sell-off.
- LH Entry Level: Between 243.71 and 250.41
- LH Take Profit: Between 209.38 and 218.76
- LH Stop Loss: Between 255.52 and 265.72
- Risk/Reward Ratio: 2.91
Ready to trade our free signals? Here is our list of the best broker for trading worth checking out.
