Market Index Analysis
- Meta Platforms (META) is a member of the NASDAQ 100, the S&P 100, and the S&P 500.
- All three indices are at or near record highs, but underlying technical factors suggest volatility ahead with cracks in the strength of the uptrend.
- The Bull Bear Power Indicator of the NASDAQ 100 shows a negative divergence, which is a bearish sign that could lead to a bearish correction within a bull trend.
Market Sentiment Analysis
Equity markets finished their remarkable second-quarter comeback, and the bullishness could extend this holiday-shortened trading week to start the second half of 2025. Chinese economic data this morning showed an unexpected expansion in June factory activity, which could suffice to push equity markets to a new record. Traders also focus on President Trump’s tariff war, which could keep US inflation on an upward trajectory and interest rates higher for longer.
Meta Platforms Fundamental Analysis
Meta Platforms is one of the world’s biggest spenders on research & development, a member of the US Big Five Tech Companies and the Magnificent Seven. It is an industry leader in the metaverse and has now embarked on a hiring spree to become a leader in advanced AI and superintelligence.
So, why am I bullish on META at record highs?
META could experience a short-term sell-off if markets drop, but I would take it as a long-term buying opportunity. META is the best performer among the Magnificent Seven, and I believe the AI hiring spree will provide tremendous value. Four more OpenAI researchers have joined their three colleagues who departed for META earlier this week. Add the healthy balance sheet, ignore the meager dividend, and the long-term outlook is extremely bullish for a buy-the-dip portfolio.

The price-to-earnings (PE) ratio of 28.85 makes META a cheap stock and priced more competitively than over 60% of its competitors. By comparison, the PE ratio for the NASDAQ 100 is 40.11.
The average analyst price target for META is 729.37, which suggests a marginally overpriced stock. I expect upward revisions to the price target in the second half of 2025.
Meta Platforms Technical Analysis
Today’s META Signal

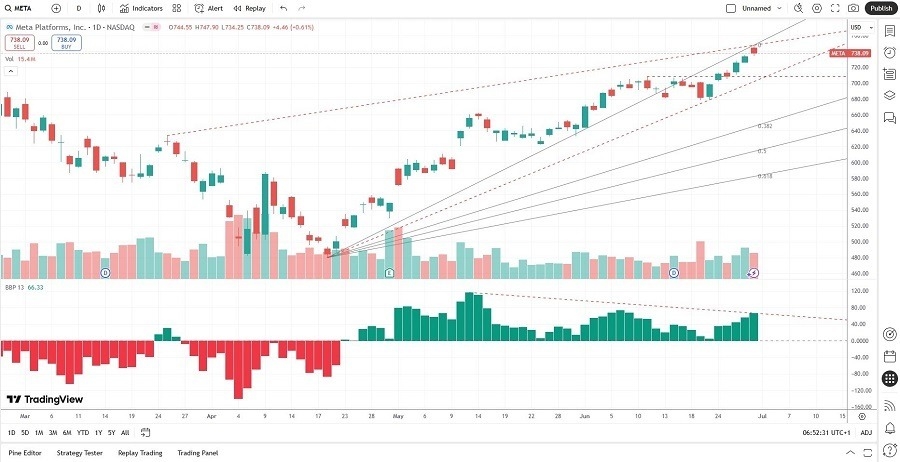
- The META D1 chart shows price action climbing the Fibonacci Retracement Fan.
- It also shows a bearish chart pattern, but support levels should limit downside risk.
- The Bull Bear Power Indicator shows a negative divergence, but an uptick this week confirms the most recent push higher.
- Trading volumes over the past week were higher during risk-on sessions.
- META ranks among the market leaders in the current uptrend.
Long Trade Idea
Enter your long position between 708.87 (a horizontal support level) and 738.09 (yesterday’s close of a bearish candlestick).
My Call
I am taking a long position in META between 708.87 and 738.09. I expect a rocky path forward, but given its tremendous fundamentals, which rank in the top five percent, its AI hiring spree, and its relatively cheap valuations as compared to other tech companies and the NASDAQ 100, I believe more long-term upside is ahead for META in 2025.
- META Entry Level: Between 708.87 and 738.09
- META Take Profit: Between 861.92 and 887.78
- META Stop Loss: Between 638.58 and 665.03
- Risk/Reward Ratio: 2.18
Ready to trade our free signals? Here is our list of the best stock trading platforms worth checking out.
