Long Trade Idea
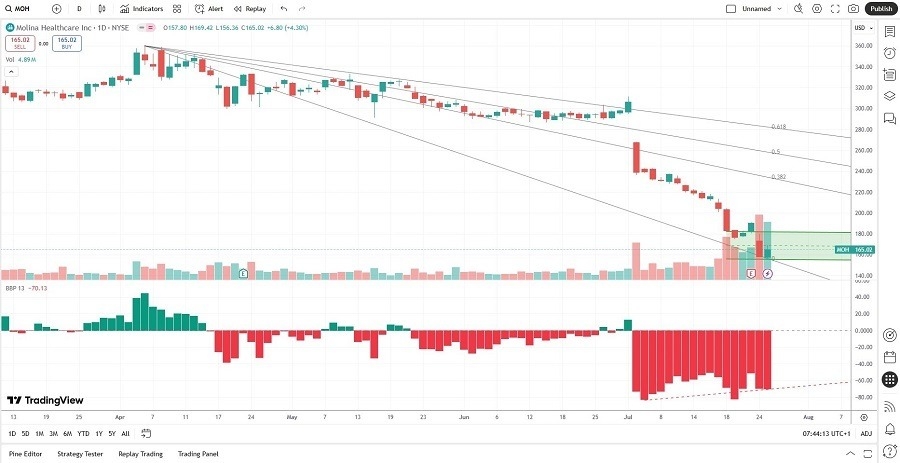
Enter your long position between 156.36 (the intra-day low of its last bullish candle) and 168.77 (the mid-range of its horizontal support zone).
Market Index Analysis
- Molina Healthcare (MOH) is a member of the S&P 500.
- This index is at or near record highs, but volumes during selloffs are higher than during rallies.
- The Bull Bear Power Indicator of the S&P 500 shows a negative divergence.
Market Sentiment Analysis
The US and the EU reached a trade deal with a baseline tariff rate of 15%, while investors await developments on the US-China trade front. This week kicks off the busiest week for second quarter earnings, and markets could experience increased volatility until the release of July’s US NFP report on Friday. While US President Trump forces countries into tariff deals, the inflationary outlook remains uncertain, and economic risks boil under the surface.
Molina Healthcare Fundamental Analysis
Molina Healthcare is a managed care company. It focuses on health insurance coverage for lower-income households through government programs, Medicaid, and Medicare.
So, why am I bullish on MOH despite its mixed earnings?
Molina Healthcare has a solid balance sheet, and the current share price reflects Medicaid and Medicare cuts and associated cost increases. The valuations are low, the company generates a massive shareholder value and decreases its share count. MOH confirmed its revenue guidance, suggesting the worst for the share price might be in the past, and it quietly signed significant Medicaid deals in four states and made smaller, strategic acquisitions.

The price-to-earnings (P/E) ratio of 8.14 makes MOH an expensive stock. By comparison, the P/E ratio for the S&P 500 is 29.48.
The average analyst price target for MOH is 255.69. It suggests massive upside potential with moderate downside risk.
Molina Healthcare Technical Analysis
Today’s MOH Signal

Molina Healthcare Price Chart
- The MOH D1 chart shows price action forming a horizontal support zone.
- It also shows price action at the descending 0.0% Fibonacci Retracement Fan level.
- The Bull Bear Power Indicator is bearish, but the trendline is bullish.
- Trading volumes during the most recent bullish candle surged, confirming support levels.
- MOH corrected as the S&P 500 rallied to fresh highs, a significant bearish development, but this stock is a defensive stock that can outperform during market corrections.
My Call
I am taking a short position in MOH between 156.36 and 168.77. While MOH sold off heavily amid government cuts to Medicaid and Medicare, the current share price reflects them. MOH continues to sign new deals, acquire new members, and has low valuations in an overvalued market. Therefore, I will buy into the attempt to confirm support levels.
- MOH Entry Level: Between 156.36 and 168.77
- MOH Take Profit: Between 236.37 and 268.15
- MOH Stop Loss: Between 141.12 and 148.54
- Risk/Reward Ratio: 5.25
Ready to trade our free daily signals? Here is our list of the best brokers for trading worth checking out.
