After flagging a Dow breakdown alert, the broader market finally heeds the warning—this selloff was written on the wall days ago.
Introduction
Thursday’s rally fizzled as all three major U.S. equity futures hit resistance at their respective “micro 5” upper-channel pivots—Dow at 45,303, Nasdaq at 23,760.75, and S&P 500 at 6,459—only to reverse sharply. By mid-Friday, bears were firmly in control, extending the selloff into a second to fourth consecutive session. This synchronised breakdown underscores waning bullish momentum and heightens the risk of a deeper pullback if critical support levels give way.
1. Dow Futures – Rising-Wedge Breakdown Accelerates
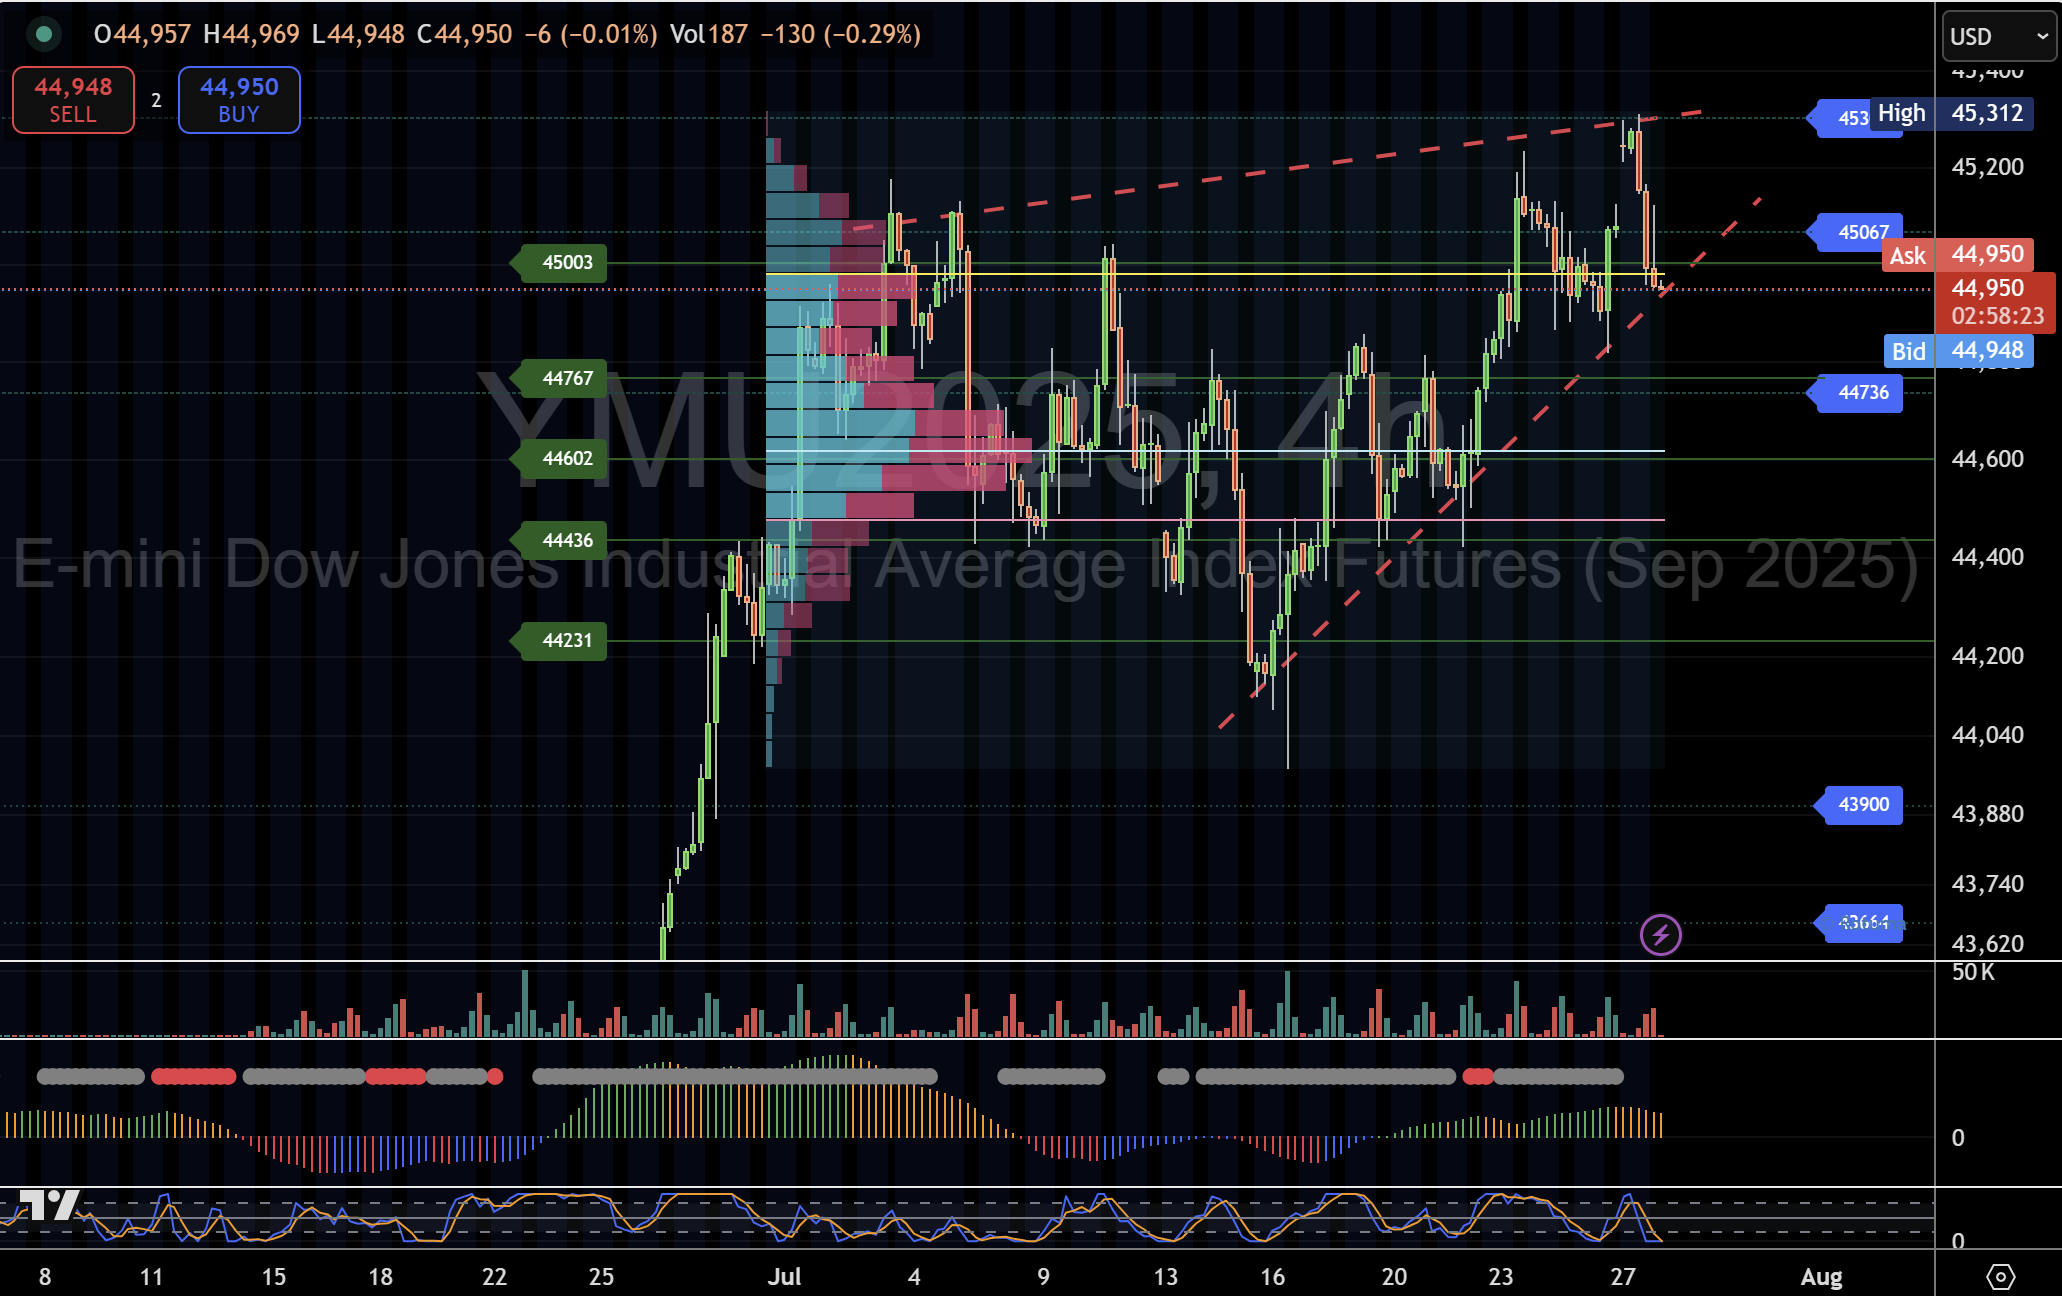
- Pattern Recap: After a textbook rising-wedge breakdown below 44,900 in late July, bears pressed the attack for a fourth session.
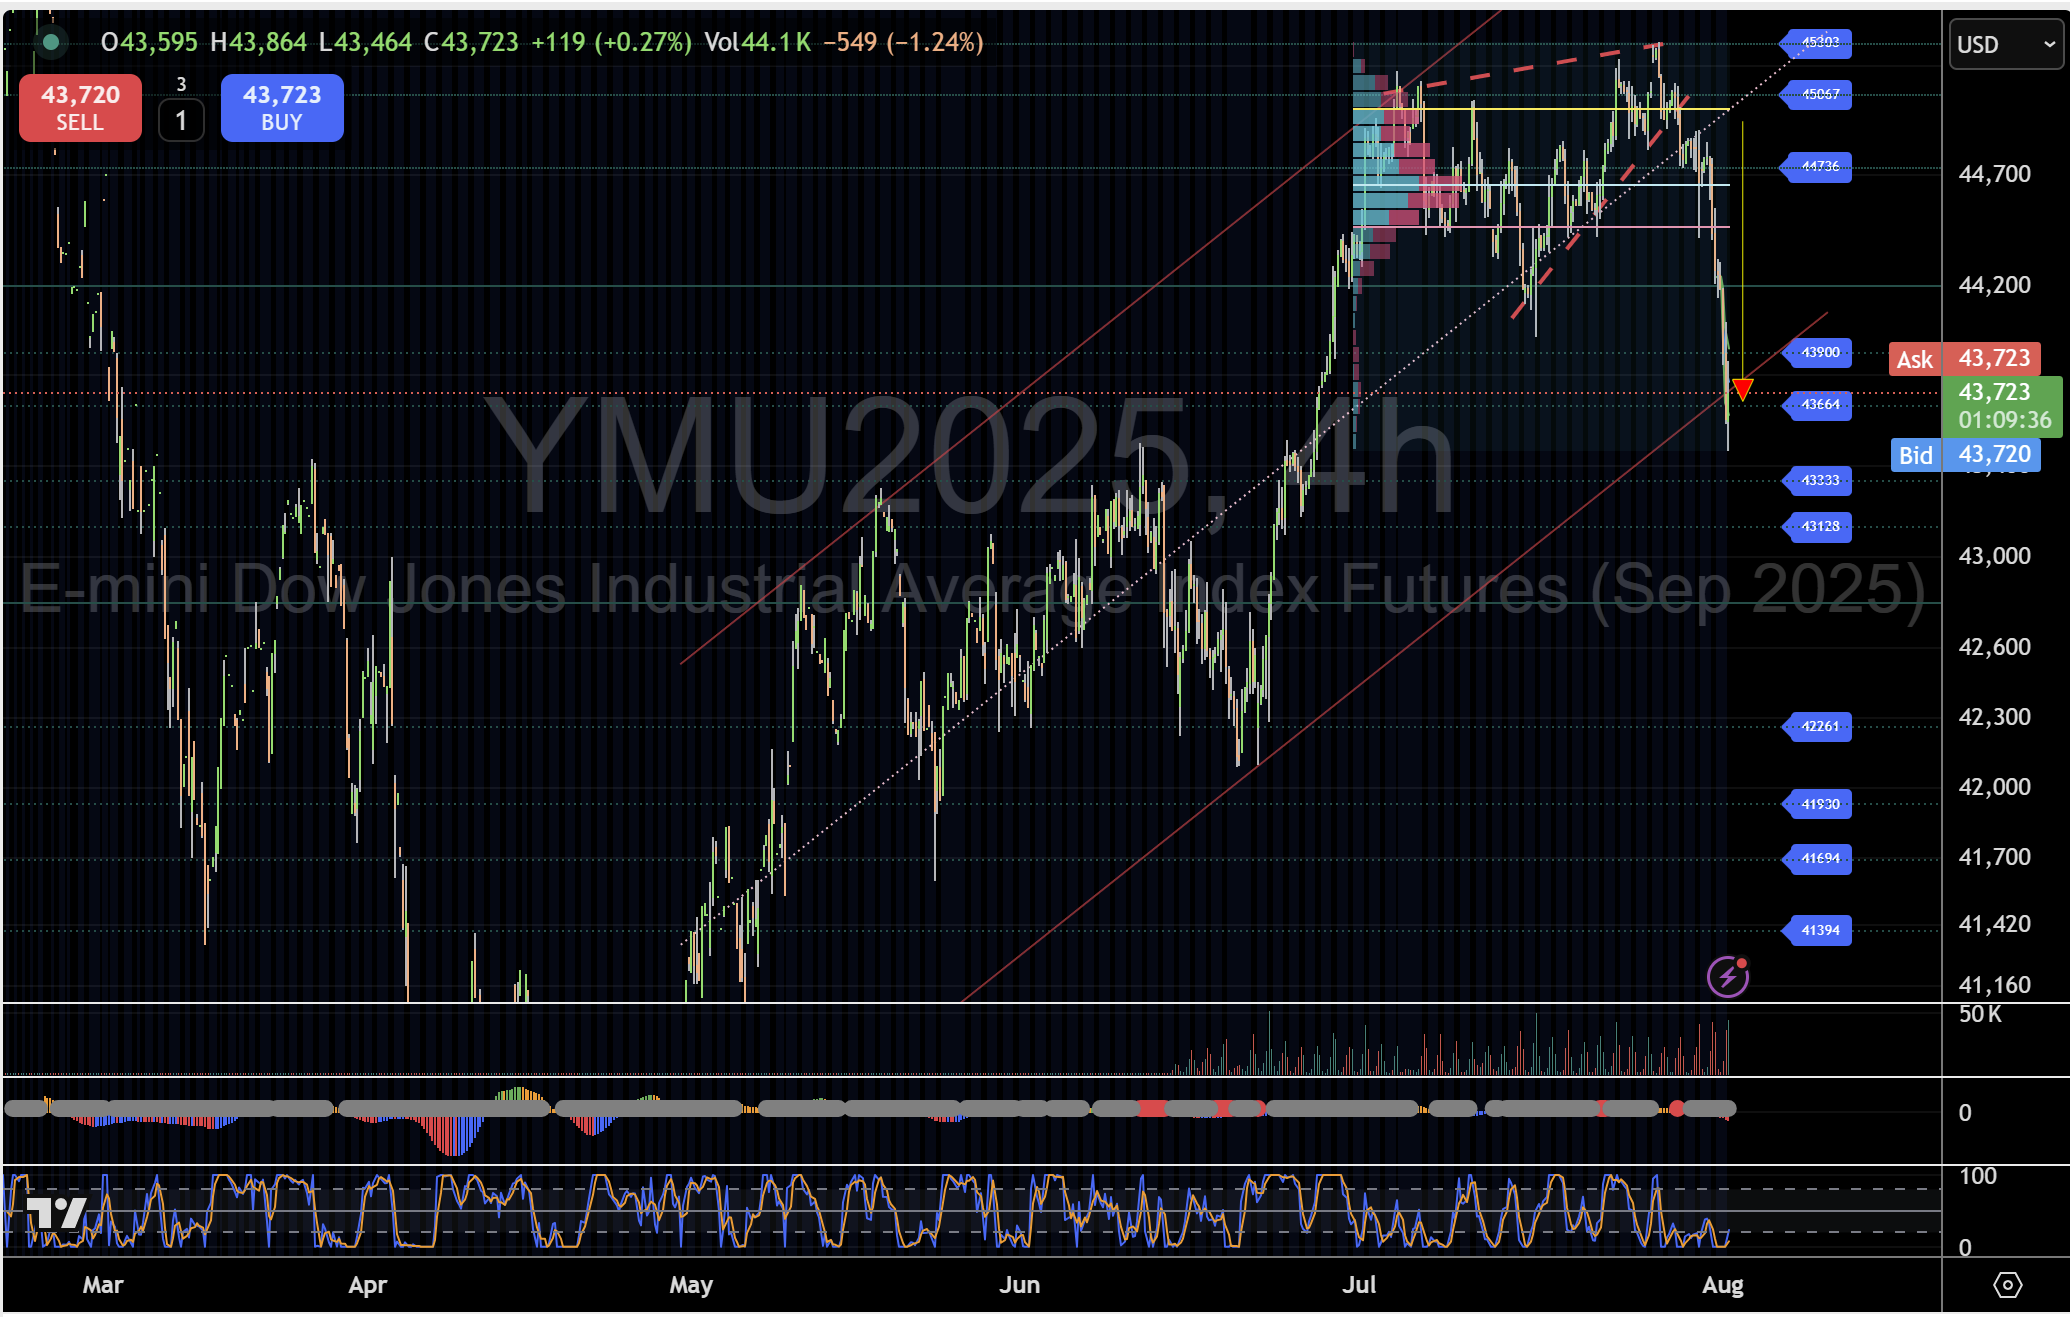
- Key Support & Targets:
- 43,664 – H4 channel lower edge (first defence)
- 43,333 – low-volume node & gap fill
- 43,128 – July swing low
- 42,797 – larger up-channel base
- Bullish Relief Zones:
- 43,900 – weekly POC (critical pivot)
- 44,200 – back toward broken wedge boundary
- Trade Plan:
- Short on H4 close below 43,664 (or retest failures)
- Stop-Loss above 43,900/43,800
- Take-Profit 50% at 43,333; remainder toward 43,128 & 42,797

Dow Futures price chart, July 28 analysis

Dow Futures price chart August 2 2025
2. Nasdaq-100 Futures – Two-Day Slide from Micro 5 High
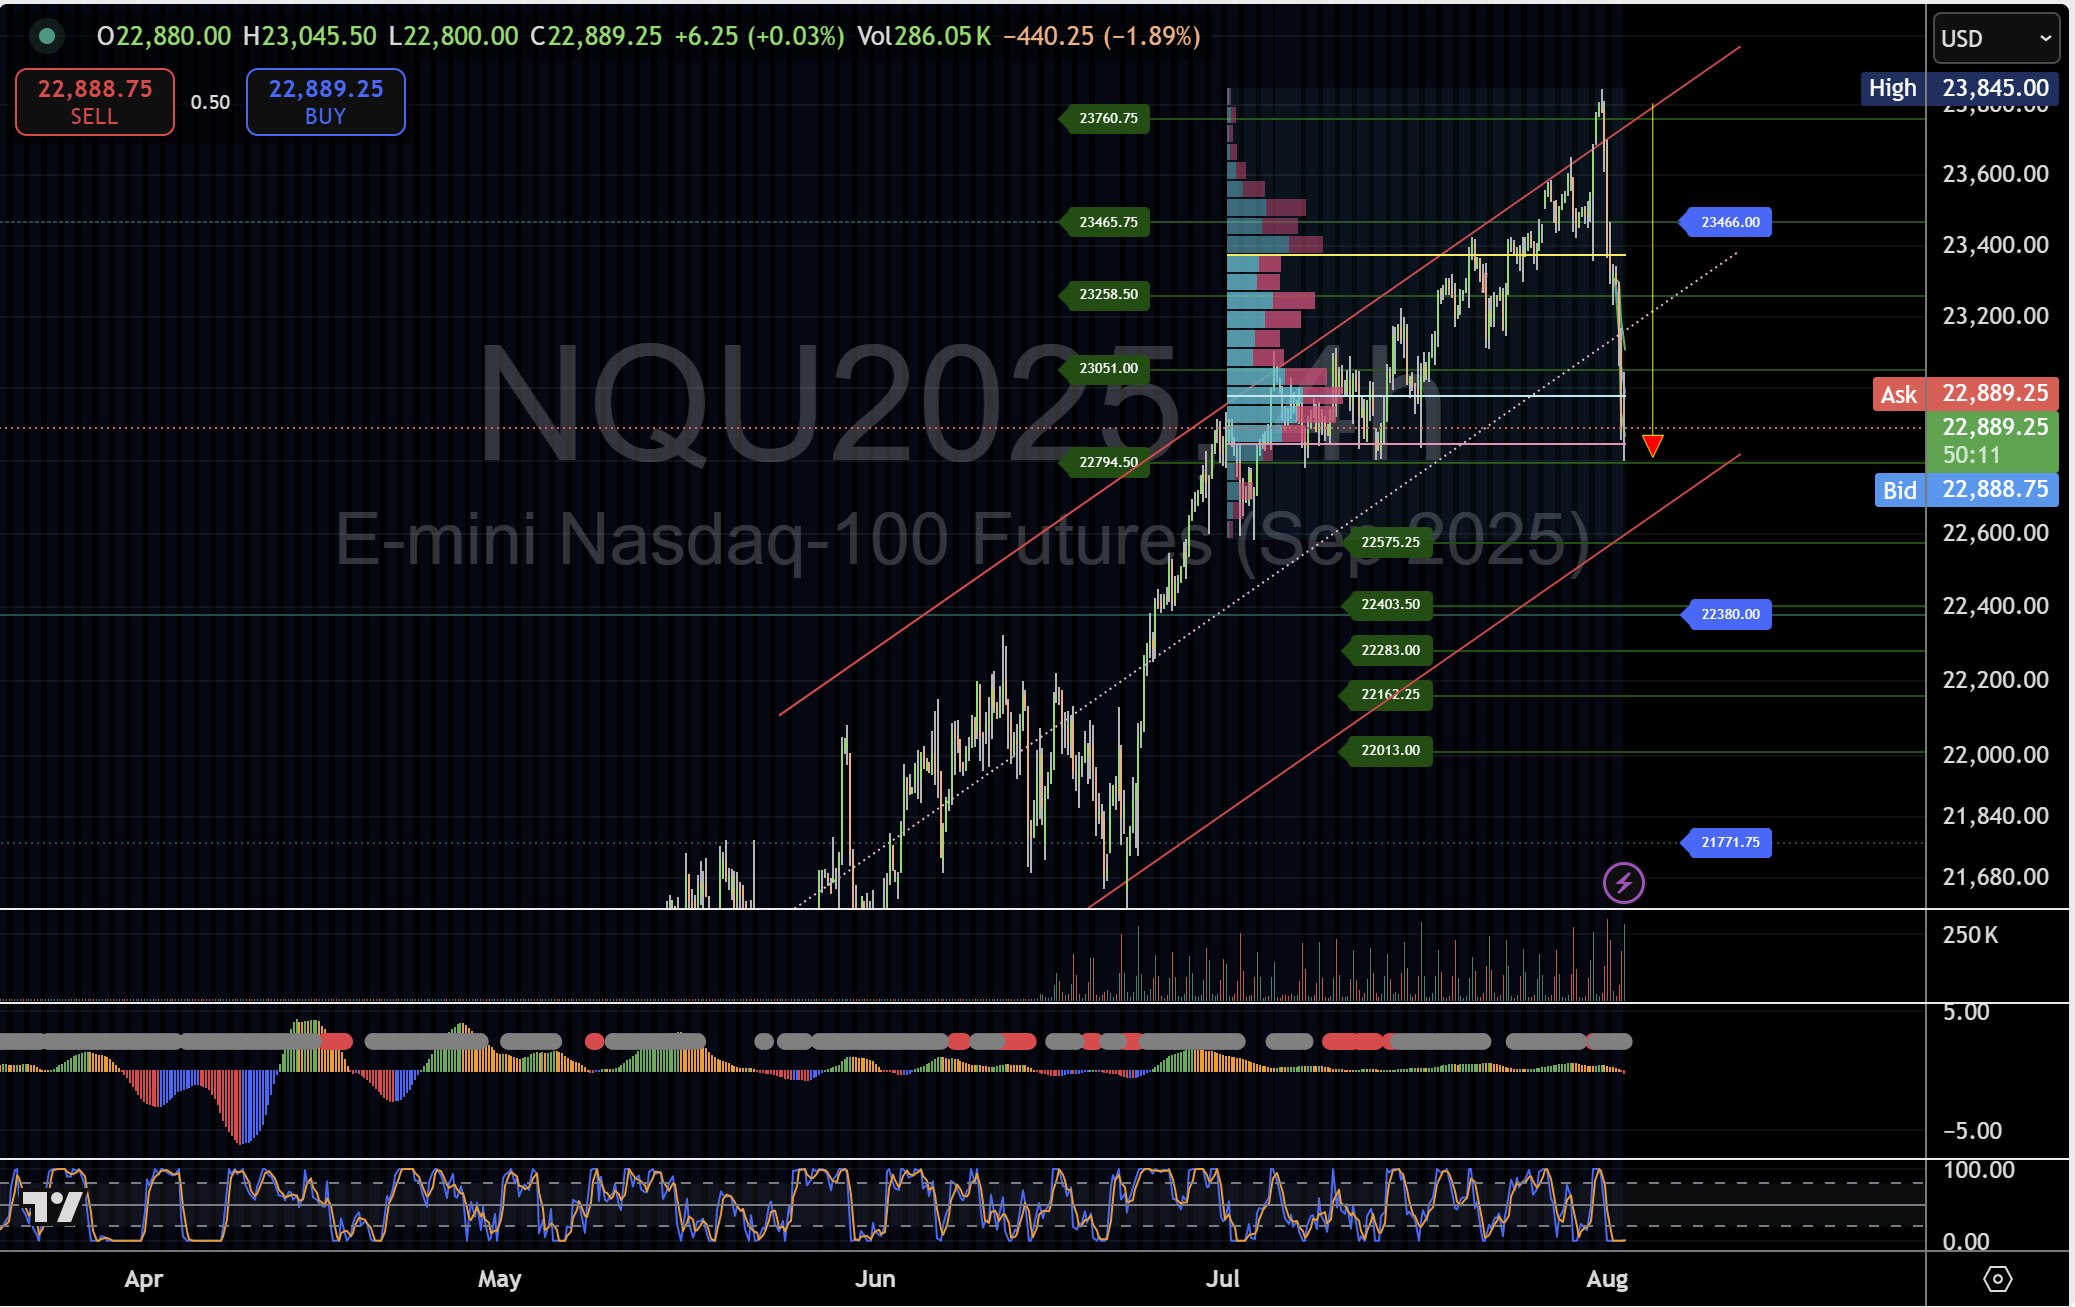
- Rejection Point: 23,760.75 – top of the H4 channel
- Support & Bear Extensions:
- 22,794.50 – micro 1 & VAL (first defence)
- 22,575.25 – micro 5 support (lower range)
- 22,380 – channel base pivot
- Below 22,380 → 22,283 (micro 3), 22,162 (micro 2), 22,013 (micro 1), 21,771.75 (pivot)
- Bullish Zones:
- 22,794.50 hold for relief
- 23,466 – prior VAH
- Trade Plan:
- Short on H4 break of 22,794.50 (confirmed by rising sell-volume)
- Stop-Loss above 22,900
- Take-Profit partial at 22,575; remainder to 22,380 & lower micro levels

Nasdaq Future price chart August 2 2025
3. S&P 500 Futures – Faltering at Micro 5 Amid Channel Breakdown
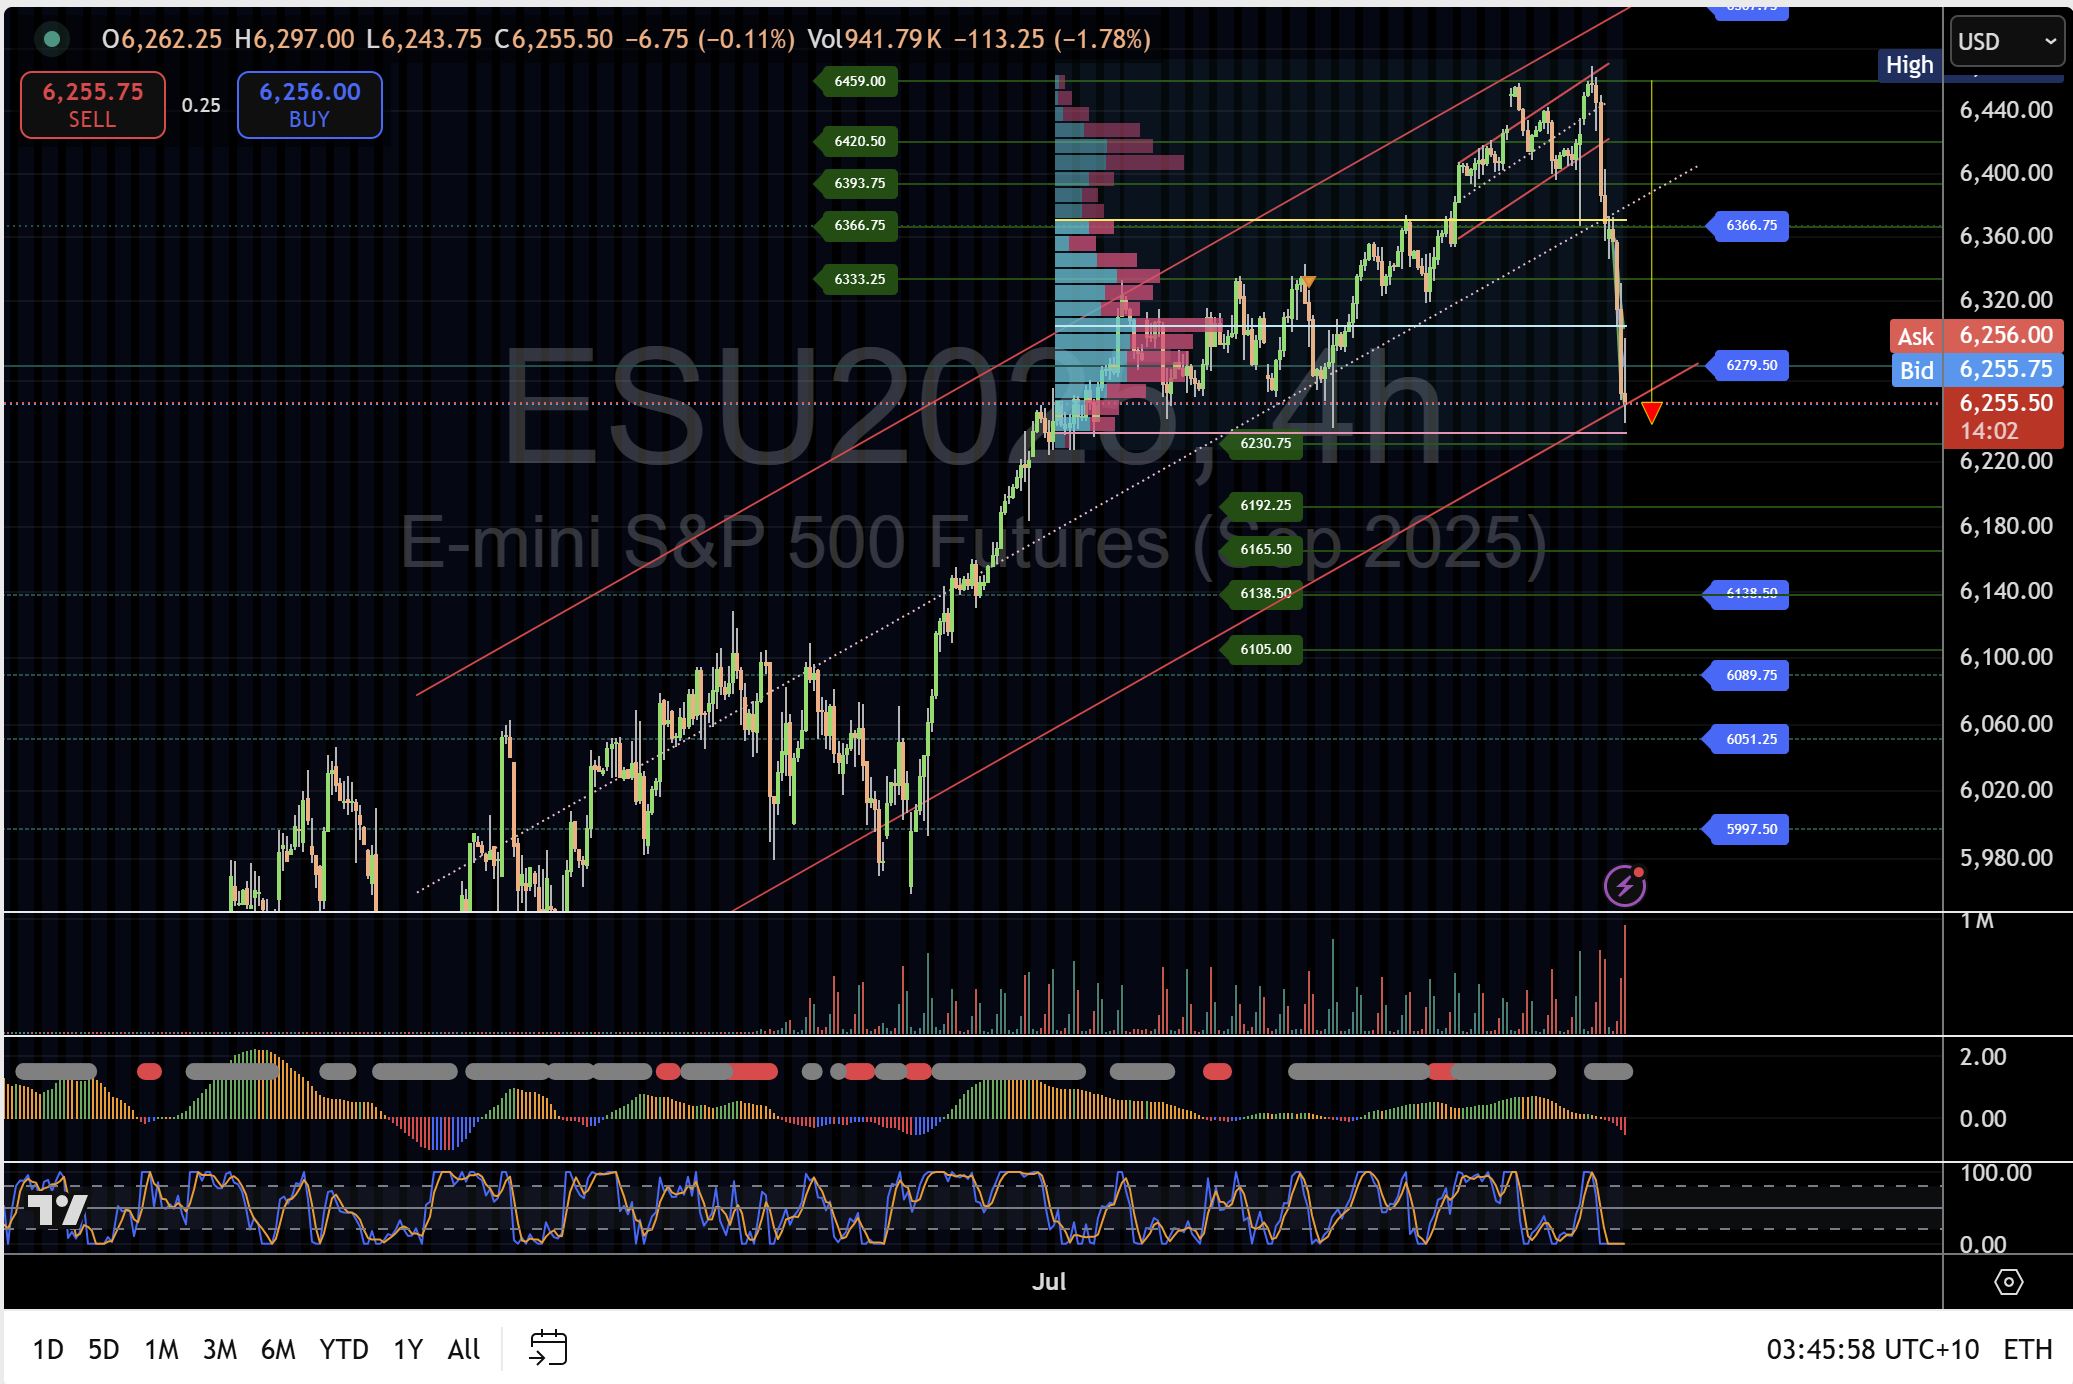
- Rejection Level: 6,459 – micro 5 upper boundary
- Key Defence & Bear Targets:
- 6,230.75 – micro 5 lower range & VAL (critical support)
- 6,192.25 – micro 4
- 6,165.50 – micro 3
- 6,138.50 – micro 2
- 6,105.00 – micro 1
- 6,089.75 – pivot below channel
- Bullish Recovery Points:
- 6,279.50 – pivot to re-enter channel
- 6,333.25 – micro 1 upper range
- 6,366.75 – VAH pivot
- Trade Plan:
- Short on H4 close below 6,230.75 with volume confirmation
- Stop-Loss above 6,279.50
- Take-Profit staggered from 6,192 to 6,089

S&P 500 Futures price chart August 2 2025
Broader takeaway
The simultaneous failures at “micro 5” highs and ensuing breakdowns highlight a shift in market sentiment. Traders should closely monitor these near-term supports—breaks will likely trigger accelerated selling toward channel bases, while holds could offer relief rallies back toward the broken pivots.
This analysis is for informational purposes only and does not constitute trading advice. Futures trading carries significant risk and may not be suitable for all investors. Always perform your due diligence and consult a qualified financial advisor before entering any trades.

