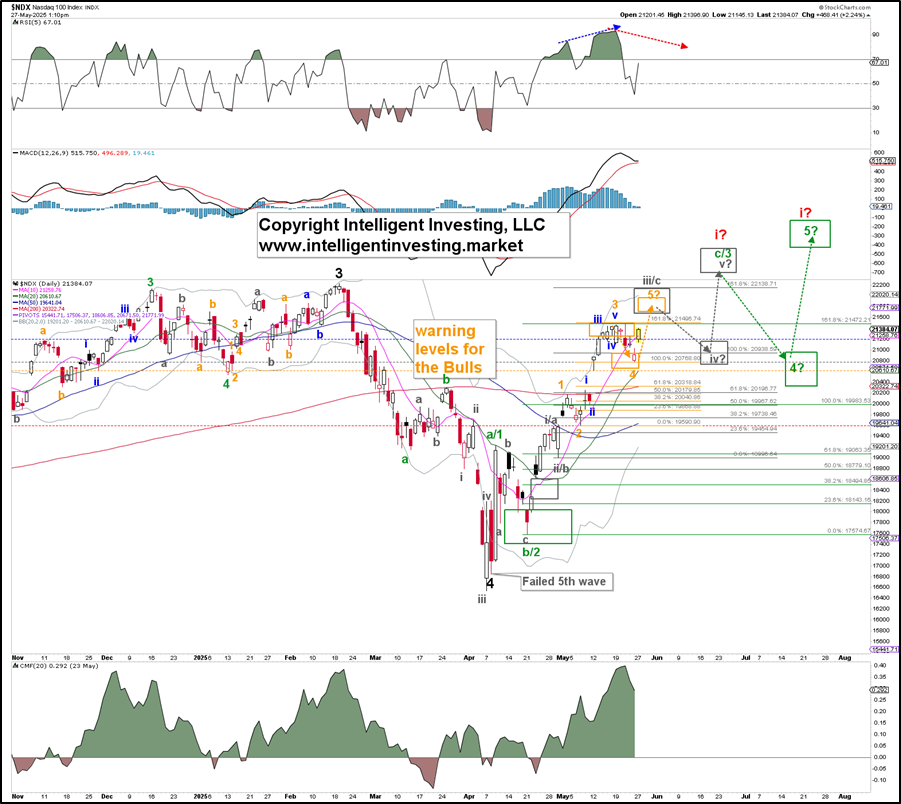
For those new to our work and analyses, using the Elliott Wave (EW) Principle and our BIMBO concept, “any Bear market/correction is a Major Buying Opportunity,” we have been Bullish on the stock market and the NASDAQ100 (NDX) since early April, when we concluded,
“we focus on the index wrapping up these smaller 4th and 5th waves, which will be followed by a rally of at least 15-25%.”
Fast forward, and the index has increased by over 25% since then. Moreover, in our last update about the NDX, we showed that the index would preferably top out for an (orange) W-3 at around $21400, then drop to $20800+/-100 for a potential (orange) W-4, and rally to $22000+/-200 for a W-5 of a grey W-iii/c. See Figure 1 below. It reached $21483 last week, dipped to $20778, and is currently trading at $21378, all right on target. Thus, objectively analyzing the stock market’s price charts using the EW has kept us on the right track; it is an essential tool for accurately assessing the stock market.
Figure 1. NDX daily chart with detailed Elliott Wave count and technical indicators

The index should now be in the orange W-5, and although we still cannot know at this stage if we will get five waves up (1-5) or only three (a-b-c) on the two remaining degrees (grey, green), we prefer the five-wave sequence due to several external factors like recent breadth thrusts we have discussed. However, we must continue to label the current advance as 1/a, 2/b, 3/c, 4?, 5? until one or the other has been proven.
Therefore, we can proceed with our preferred bullish EW count. We continue to expect the orange W-5 to complete at $22000 +/- 200, followed by a grey W-iv down to $21000 +/- 200, and a grey W-v ideally up to $22400-900, contingent on the index’s price remaining above at least $20778 (grey warning level) and especially $20613 (orange warning level).

