Bullish view
- Buy the BTC/USD pair and set a take-profit at 125,000.
- Add a stop-loss at 110,000.
- Timeline: 1-2 days.
Bearish view
- Sell the BTC/USD pair and set a take-profit at 110,000.
- Add a stop-loss at 125,000.

Bitcoin price staged a strong comeback and reached an all-time high as demand continued soaring and supply dropped. The BTC/USD pair crossed the important resistance level at 120,000 for the first time ever. It has jumped by over 60% from its lowest level in April.
Bitcoin Rally Accelerates Amid High Demand
The BTC/USD pair surged as investors remained optimistic about demand from global investors. Most of this demand is coming from the United States, where ETF inflows have surged in the past few months.
ETFs had over $2 billion in inflows last week as the cumulative figure crossed the important resistance level of $50 billion for the first time ever. Some of the best-performing ETFs are by companies like BlackRock, Fidelity, and Ark Invest. Indeed, the BlackRock ETF is closing the gap with the flagship gold fund.
The BTC/USD pair has also surged because of the ongoing supply crash as demand jumped. There are now over 1.2 million coins in exchanges, a figure that has plunged in the past few months.
Further, Bitcoin price has surged as investors wait fo the upcoming Crypto Week in the United States. This will be an important week in which epublicans will consider thee crypto-related bills focused on stablecoins, CBDCs, and the roles of the SEC and CFTC.
BTC/USD Technical Analysis
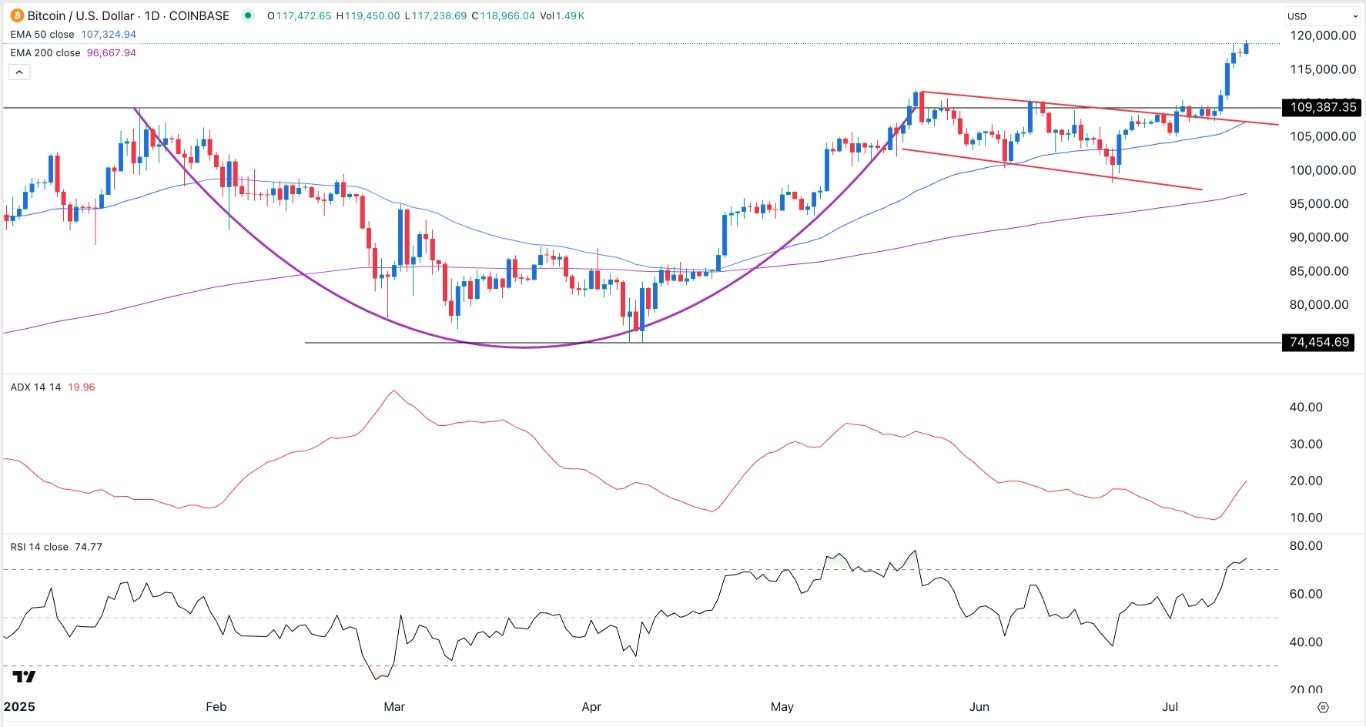
The daily chart shows that Bitcoin price bottomed at 74,455 in April as concerns about tariffs rose. It jumped to a record high of 120,000 during the weekend.
The coin formed a golden cross pattern as the 50-day and 200-day Exponential Moving Averages (EMA) crossed each other. Also, the BTC/USD pair crossed the important resistance level at 109,387, the upper side of the cup-and-handle pattern.
Further technical indicators show that the Relative Strength Index (RSI) and the Average Directional Index (ADX) have all pointed upwards in the last few weeks.
The ADX has jumped to 20, a sign that the trend was gaining strength. Also, the RSI moved to the overbought level. Therefore, the most likely scenario is where the BTC/USD pair continues rising to 125,000 this week.
The alternative scenario is where the pair dropped to 110,000 in a process known as a break-and-retest pattern. This retest is a common continuation sign.
Ready to trade BTC/USD? Here’s a list of some of the best crypto brokers to check out.
Crispus Nyaga is a financial analyst, coach, and trader with more than 8 years in the industry. He has worked for leading companies like ATFX, easyMarkets, and OctaFx. Further, he has published widely in platforms like SeekingAlpha, Investing Cube, Capital.com, and Invezz. In his free time, he likes watching golf and spending time with his wife and child.
