Today’s Gold Analysis Overview:
- The overall Gold Trend: Attempting to maintain a bullish outlook.
- Today’s Gold Support Levels: $3262 – $3200 – $3140 per ounce.
- Today’s Gold Resistance Levels: $3318 – $3360 – $3400 per ounce.

Today’s gold trading signals update:
- Sell Gold from the resistance level of $3373 with a target of $3240 and a stop-loss at $3400.
- Buy Gold from the support level of $3230 with a target of $3370 and a stop-loss at $3200.
Technical Analysis of Gold Price (XAU/USD) Today:
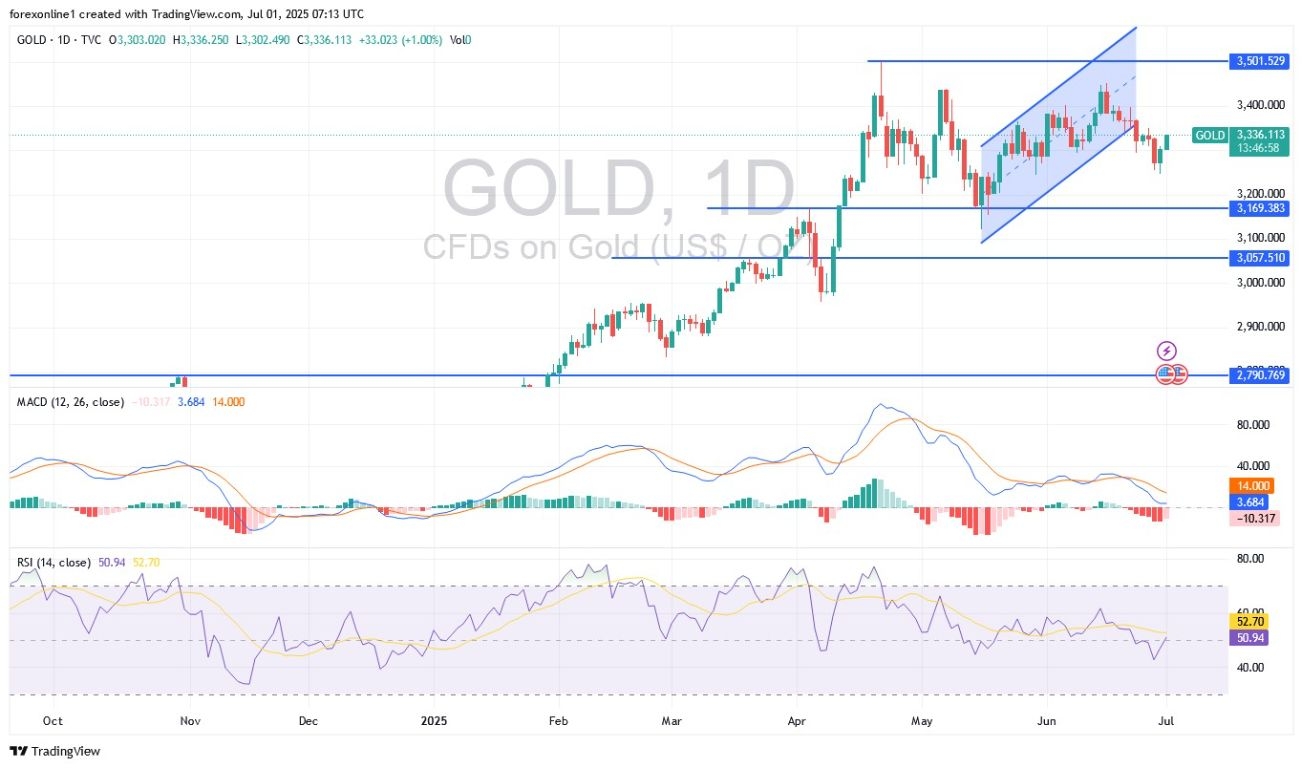
Spot gold prices are starting positively, recovering from their sharp losses that pushed them to the $3246 per ounce support level, the lowest for the gold price index in five weeks. Gold’s recovery attempts at the beginning of the trading week reached the $3305 per ounce resistance level, around which it is currently stabilizing at the time of writing. The gains in gold prices have been supported by the weak performance of the US dollar. According to gold trading platforms, gold prices plummeted by 4.8% after the cessation of military operations between Iran and Israel, which had previously increased investor demand for gold as a safe haven and pushed prices towards the $3452 per ounce resistance level.
Trading Tips:
We advise buying gold on every dip, but without taking excessive risks, and closely monitoring the factors influencing the market.
Will Gold Prices Rise in the Coming Days?
As mentioned before and based on the daily chart performance and gold analysts’ forecasts, the overall trend for gold prices will remain bullish. As previously stated, the $3300 per ounce resistance will continue to be important for maintaining strong bullish control over gold’s direction. Furthermore, global geopolitical and trade tensions, central bank gold purchases, and a weak US dollar will remain the primary drivers of strength in the gold market. The strategy of buying gold on dips remains valid.
The RSI (Relative Strength Index) is attempting to break above the midline, but at the same time, the MACD (Moving Average Convergence Divergence) lines are still trending downwards. According to commodity market analysts at Citi Bank, gold prices were under scrutiny in the second half of June due to de-escalation in the Middle East and improved global growth prospects, despite a weaker US dollar and declining Treasury yields. Analysts added that the gold market deficit should peak in Q3 2025 and fundamentally weaken thereafter, driven by lower investment demand. Furthermore, the US bank further suggests that the expected success of the “Big and Beautiful Bill” and upcoming trade deals with key partners should help reduce growth concerns in the United States and impact gold demand.
Meanwhile, gold could trade in a range of $3500 and $3750 per ounce by the second half of 2026.
Overall, optimism surrounding US trade agreements, the de-escalation of Middle East tensions, and the strong rally in US equities have significantly reduced gold’s attractiveness. However, market expectations for a Federal Reserve rate cut in July typically benefit gold’s appeal, as lower rates reduce the opportunity cost of holding non-yielding bullion.
Ready to trade our Gold price forecast? We’ve made a list of the best Gold trading platforms worth trading with.
