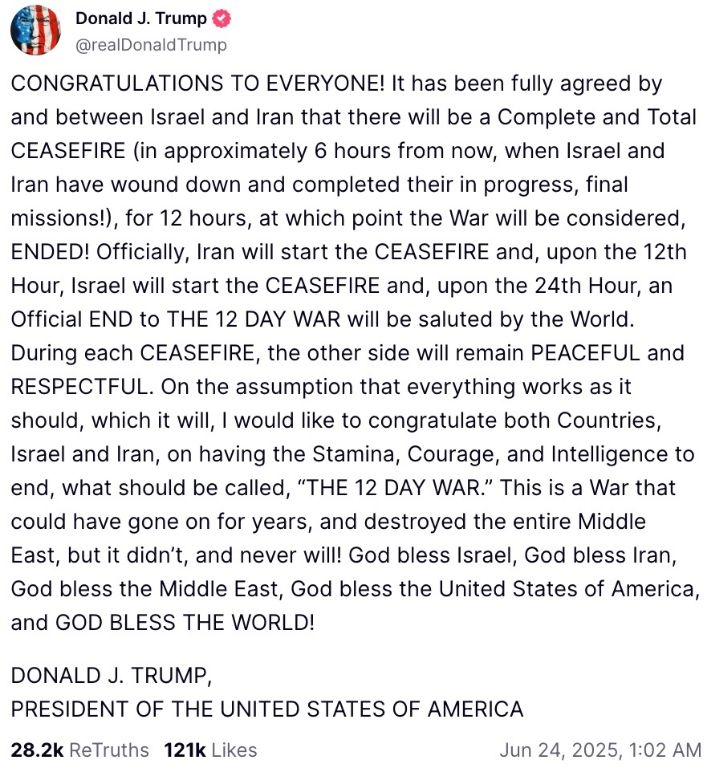
Ripple’s rally follows a volatile period driven by geopolitical tensions fueled by the Israel-Iran conflict and other market dynamics. Despite the recent drop to $1.90, XRP’s price action today and fundamentals suggest a potential rally of over 580% to double digits.
Here are three key reasons supporting this bullish outlook:
- an Israel-Iran ceasefire-driven boost in risk appetite
- growing investor exposure to XRP investment products
- and a technical bull flag pattern targeting $15 and beyond
Israel-Iran Ceasefire Boosts Risk Appetite
The announcement of a “total ceasefire” between Israel and Iran by US President Donald Trump on June 24 has significantly lifted global risk appetite, propelling crypto prices higher, including XRP.
In a post on social media platform Truth Social on Tuesday, Trump said that Israel and Iran have agreed to a full ceasefire set to begin within a few hours, potentially ending what he referred to as “The 12 Day War.”
“It has been fully agreed by and between Israel and Iran that there will be a complete and total ceasefire (in approximately 6 hours from now),” Trump said, adding:
“When Israel and Iran have wound down and completed their in progress, final missions, for 12 hours, at which point the War will be considered ENDED! ”
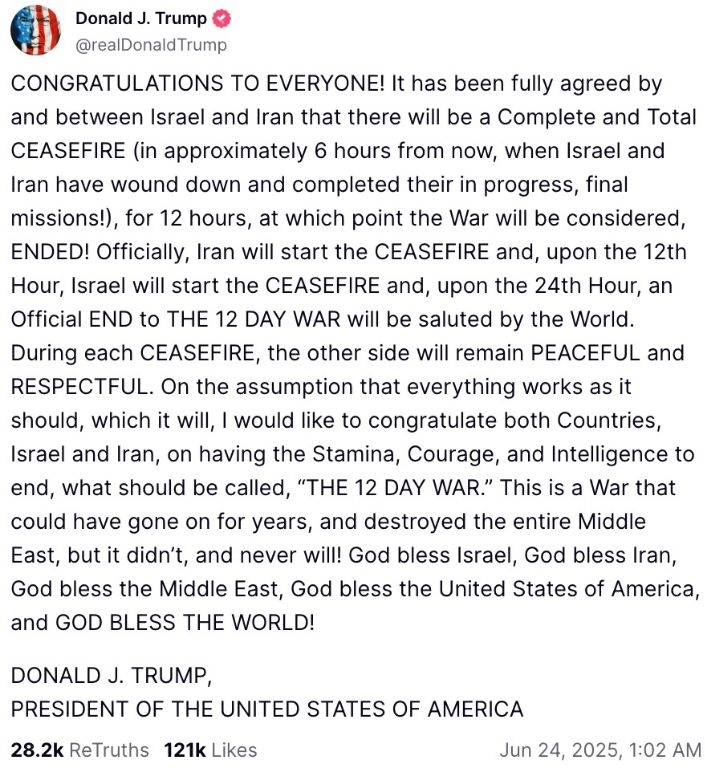
Source: Donald J. Trump, Truth Social
The 12-day conflict, marked by Israel and US strikes on Iranian nuclear sites and Iranian retaliatory missile attacks on Israel and US military bases in Qatar, had triggered a risk-off sentiment, causing XRP to plunge 12% from its local high.
The ceasefire, confirmed by Israeli Prime Minister Benjamin Netanyahu and Iranian Foreign Minister Abbas Araghchi, has eased fears of a broader Middle East conflict and potential disruptions to oil supplies through the Strait of Hormuz.
Trump said:
“This is a War that could have gone on for years, and destroyed the entire Middle East, but it didn’t, and never will!”
This de-escalation has spurred a marke-twide rally, with Bitcoin rising as high as $106,100 during the late New York trading hours on June 23 and altcoins like Ethereum and Solana gaining 8–10%.
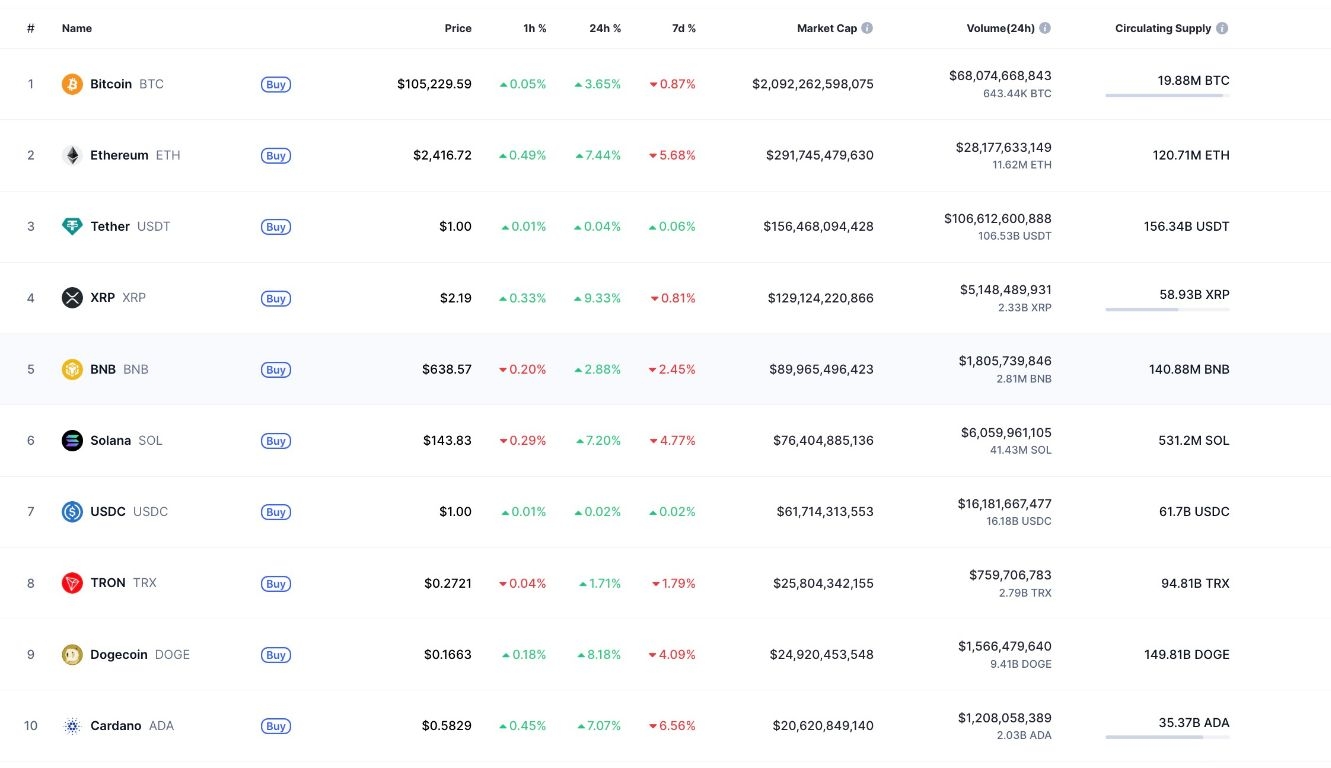
Performance of Top Cryptocurrencies. Source: CoinMarketCap
The ceasefire, combined with improving investor sentiment as evidenced by the Crypto Fear & Greed Index jumping into the “greed” zone at 65 on June 24, up from 47 the day before, indicates the market is poised for further gains if macroeconomic conditions remain favorable.
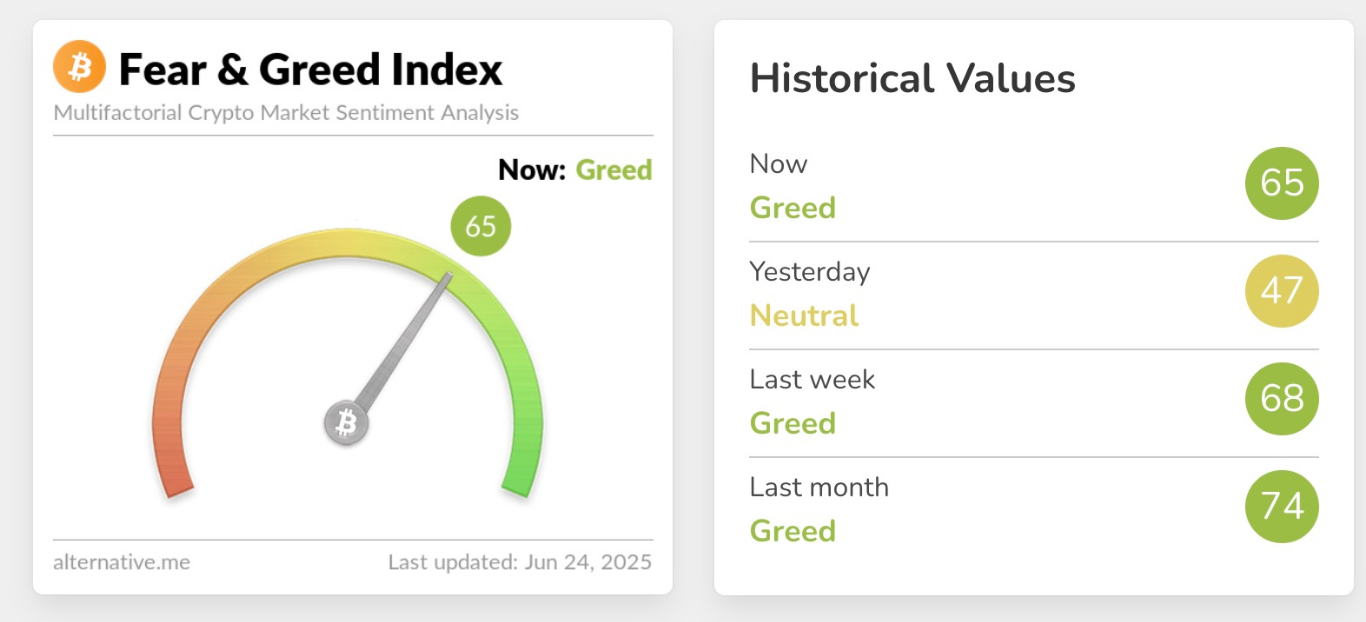
Crypto Fear and Greed Index. Source: Alternative.me
XRP, the fourth-largest cryptocurrency by market capitalization, has benefited from the improving investor sentiment, rising as much as 16% from an eight-week low of $1.90 on June 22 to an intra-day high of $2.21 on June 24.
As geopolitical stability improves, XRP is well-positioned to capitalize on renewed investor confidence, potentially driving its price toward new highs.
Investors Increase Exposure to XRP Investment Products
Institutional demand for XRP investment products appears to be awakening, according to data from CoinShares.
XRP exchange-traded products (ETPs) posted a weekly inflow of $2.7 million in the week ending June 20, bringing their inflows for the month to $10.5 million and year-to-date inflows to $209 million.
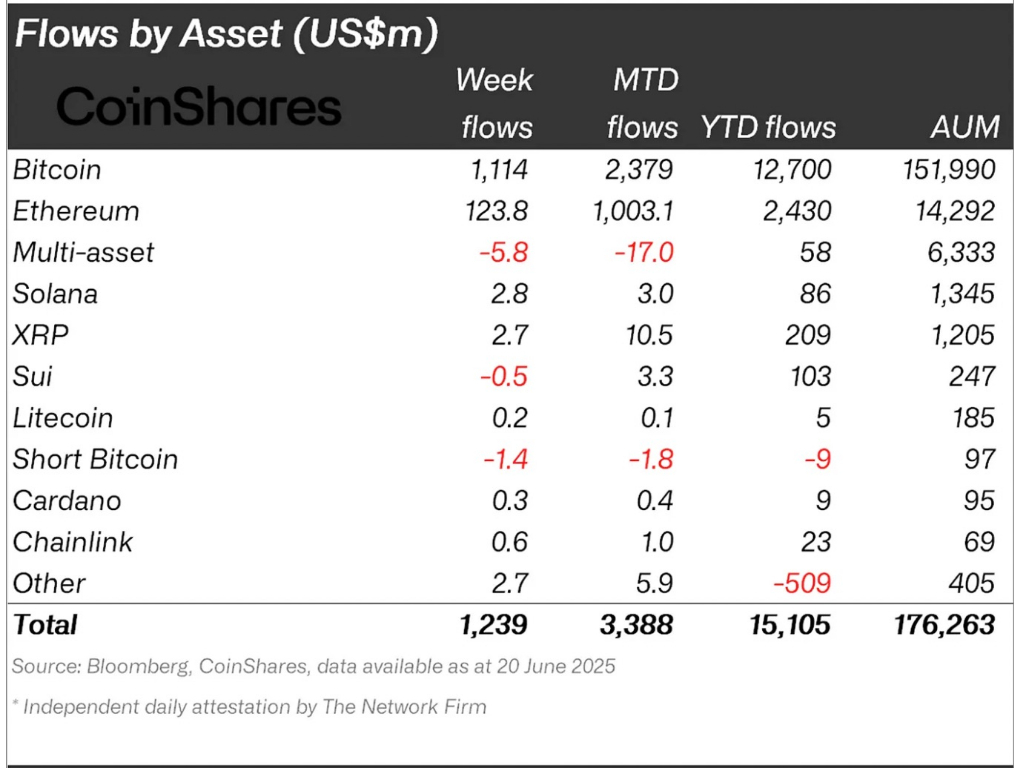
Crypto Funds Net Flows (as of May 30). Source: CoinShares
Other top-cap altcoins such as Bitcoin (BTC), Ether (ETH), and Solana (SOL) saw inflows of $1.1 billion, $123.4 million, and $2.8 million, respectively, indicating an increased institutional appetite for cryptocurrency investment products, which may positively impact prices.
XRP’s Bull Flag Projects a Rally to $15
The XRP/USD pair is expected to resume its prevailing bullish momentum despite the price correction over the last six months, as it paints a classic technical structure with an upside outlook.
The XRP price action has formed a “bull flag” chart pattern in the weekly time frame as shown in the chart below. A bull flag is a bullish continuation pattern that forms when the price consolidates lower in a descending channel (flag) following a strong move upward (flagpole).
The pattern is resolved when the price breaks above the channel’s upper trendline, typically rising by as much as the flagpole’s height.
In XRP’s case, the bulls’ next attempt is to break above the channel’s upper trendline at $2.22. Such a move could lead to its price rallying by as much as the flagpole’s height, which sets the technical target to be around $15, a 586% uptick from the current price.
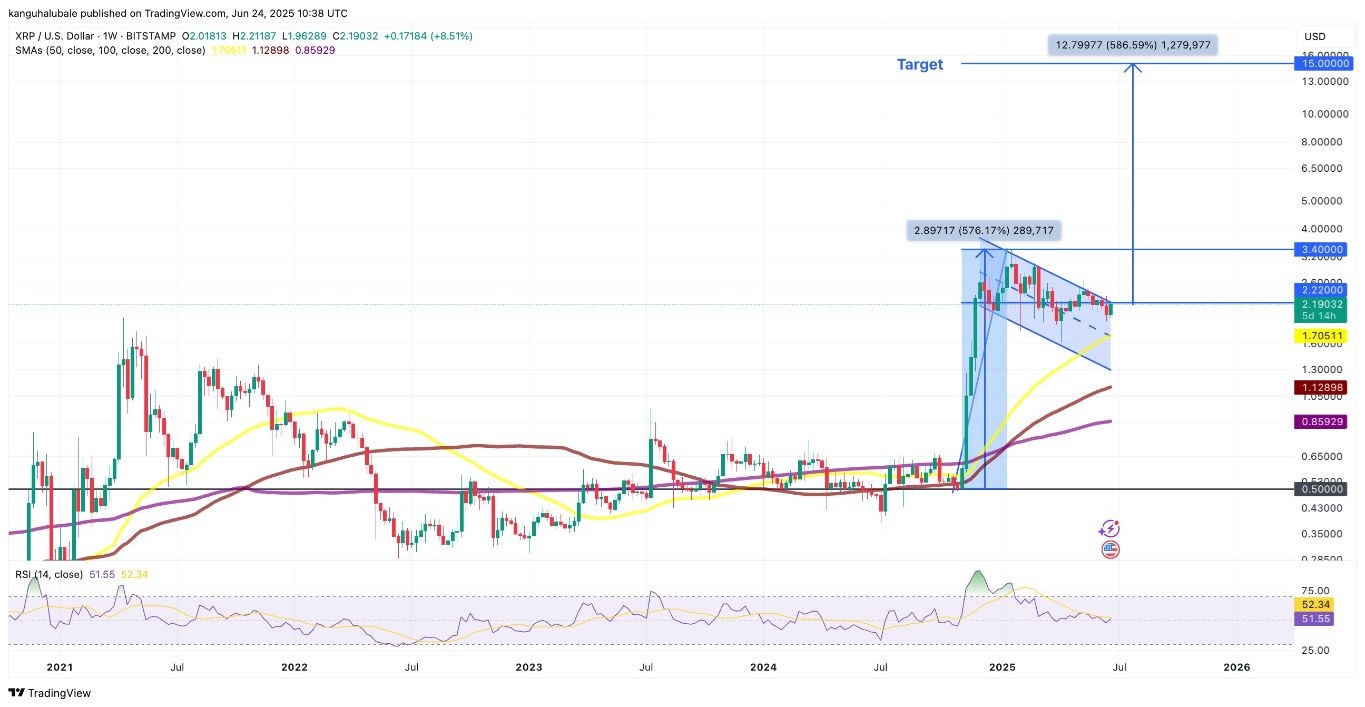
XRP/USD Daily Chart Featuring Bull Flag Pattern. Source: TradingView
XRP’s daily relative strength index is still moving downward after dropping from 94 to 62 in a fortnight. This suggests that the chances of a continued correction are relatively high.
Therefore, a retreat from $2.19 could see a retest of the flag’s middle trendline at around $1.70, embraced by the 50-weekly simple moving average. Lower than that, the price could move toward the lower boundary at $1.30.
Ready to trade our technical analysis on Ripple? Here’s our list of the best MT4 crypto brokers worth reviewing.

