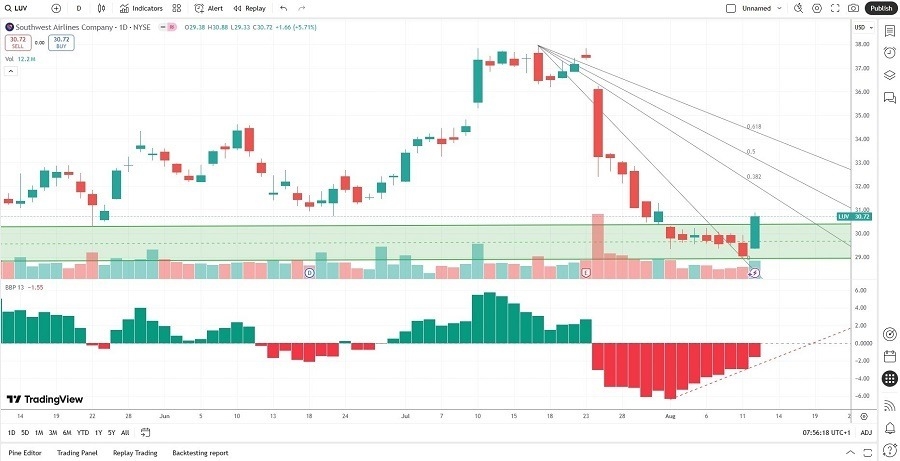
Long Trade Idea
Enter your long position between 29.69 (the mid-point of its horizontal support zone) and 30.88 (yesterday’s intra-day high).
Market Index Analysis
- Southwest Airlines (LUV) is a member of the S&P 500
- This index continues to reflect record highs, but trading volumes remain bearish
- The Bull Bear Power Indicator of the S&P 500 shows a negative divergence
Market Sentiment Analysis
Equity markets recorded fresh all-time highs after the CPI report triggered widespread optimism for a September interest rate cut. Market participants chose to ignore the rising core CPI and opted to celebrate the in-line headline inflation. It resembles market behavior in the summer before the global financial crisis. While tariffs generated record revenues in July, the trade deficit also increased. It is premature to celebrate victory on the inflation front, and traders should exercise caution as equity markets climb a wall of worry.
Southwest Airlines Fundamental Analysis
Southwest Airlines is the fourth-largest US-based airline, serving over 100 destinations across 42 states and ten countries in the Gulf of Mexico and the Caribbean. It operates an all-Boeing 737 fleet of over 810 aircraft. It also has over 500 Boeing 737 MAX on order.
So, Why Am I Bullish on LUV After Its Breakout?
Southwest Airlines has struggled in July with a 30%+ drop in its share price, but valuations remain high. Still, I believe the current price reflects all the bad news, and the improvement in pricing power should provide a nice boost in its current quarter. The Peg ratio suggests massive upside potential ahead, and I like the current price-to-book ratio.
Southwest Airlines Fundamental Analysis Snapshot

The price-to-earnings (P/E) ratio of 30.42 makes LUV an expensive stock. By comparison, the P/E ratio for the S&P 500 is 29.41.
The average analyst price target for LUV is 31.86. It suggests limited upside potential, but I think the stock remains mispriced at current levels.
Southwest Airlines Technical Analysis
Today’s LUV Signal

- The LUV D1 chart shows price action completing a breakout above its horizontal support zone
- It also shows price action approaching its descending 38.2% Fibonacci Retracement Fan level
- The Bull Bear Power Indicator is bearish, but has been increasing, with an ascending trendline
- The trading volumes during yesterday’s breakout were higher than average bearish trading volumes
- LUV corrected as the S&P 500 moved higher, a significant bearish trading signal, but underlying bullish pressures are rising
My Call
I am taking a long position in LUV between 29.69 and 30.88. I think the breakout, supported by higher trading volumes and sparked by an improvement in pricing power, will deliver a solid quarter. Therefore, I am buying the dip, as LUV remains mispriced at current levels.
- LUV Entry Level: Between 29.69 and 30.88
- LUV Take Profit: Between 36.25 and 37.96
- LUV Stop Loss: Between 26.99 and 27.41
- Risk/Reward Ratio: 2.43
Ready to trade our free daily signals? Here is our list of the best brokers for trading worth checking out.
