The S&P 500 is one of the most traded and followed equity indices, as its 500 components account for approximately 80% of the US market capitalization.
Are you curious about the market predictions by top Wall Street firms on where the S&P 500 will finish in 2025? Do you want to know what could impact price action in the second half of 2025? Read my analysis below to learn how the industry sees the US stock market over 2025 and my take on it.
Current Situation of the S&P 500
Below are core aspects traders should consider when analyzing the outlook for the S&P 500 Index for the second half of 2025, with the second quarter earnings season set to kick off.
Earnings per Share (EPS)
- First quarter EPS grew 13.7% year-over-year, and 76.3% of companies beat expectations.
- The S&P 500 EPS has shown consistent growth.
- Q2 EPS estimates call for a sharp slowdown to 5.0% year-over-year growth.
Macroeconomic Conditions
- Inflation – While inflation retreated from its 40-year peak, it remains stubbornly elevated. It keeps the US Fed sidelined and could translate into higher rates for much longer. Stagflation is a threat that equity markets have not priced into current valuations.
- US GDP – The GDP for the US is on a downward trajectory and likely to clock in below average as the trade war with China continues.
- Unemployment rate – The US labor market remains resilient, but cracks appear, and wages for most consumers barely keep up with inflation.
- Consumer spending – Two-thirds of the US GDP relies on consumer spending, which could follow the trend of consumer confidence to the downside.
US Tariff War
- Tariffs increase prices across the supply chain and will keep inflation and inflationary pressures elevated.
- Chinese tariffs stand at 55%, while most other countries face 10% to 50% tariffs, depending on the sector.
- US tariffs will not only keep upward pressure on inflation but also apply downside pressure on GDP.
The Evolution of S&P 500 Forecasts
A price forecast is an analyst’s opinion based on current market conditions, which analysts modify throughout the year to reflect ongoing changes. Therefore, traders should consider any price forecast as a market thermometer, and not a price target to strive for.
For example, at the end of 2024, the S&P 500 forecasts for the end of 2025 were notably higher. US tariffs caused major banks and investment firms to slash their price targets.
Here are seven of the most recent forecast changes:
|
Firm |
Previous Forecast |
Updated Forecast |
Percentage Change |
|
RBC Capital Markets |
6,600 |
5,500 |
-16.67% |
|
HSBC |
6,700 |
5,600 |
-16.42% |
|
Oppenheimer |
7,100 |
6,000 |
-15.49% |
|
Yardeni Research |
7,000 |
6,000 |
-14.29% |
|
Goldman Sachs |
6,500 |
5,700 |
-12.31% |
|
Barclays |
6,600 |
5,900 |
-10.61% |
|
UBS |
6,400 |
5,800 |
-9.38% |
Each piece of significant data could cause analysts to revise their S&P 500 forecast, but the trend for the second half of 2025 has been bearish. Still, three analysts began to increase their forecasts. For example, Deutsche Bank slashed its forecast from 7,100 to 6,150 but later revised it upwards to 6,550. The forthcoming earnings season might bring further revisions.
Technical Analysis for the S&P 500 for the Second Half of 2025
We have conducted our in-house S&P 500 second quarter outlook using the Fibonacci Retracement Fan and the Bull Bear Power Indicator.
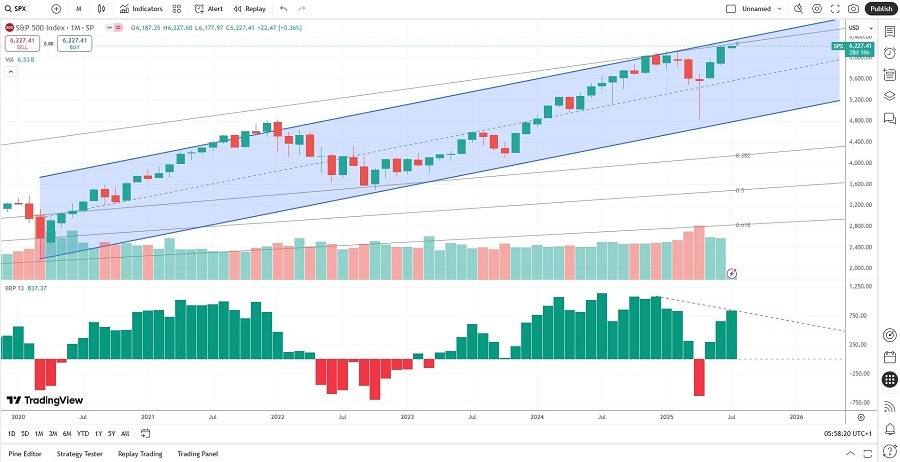
First, we will analyze the monthly chart to get a better long-term view of what has happened.

S&P 500 Index: Monthly Price Chart
Here is what you should know:
- After recording a pandemic low of 2,191.86, the S&P 500 advanced to a post-pandemic peak of 4,818.62.
- The rally destroyed value, since fiscal debt-fueled stimuli and interest rate cuts fueled the rally. It also powered a retail investor-led push into popular social media trending stocks.
- The result was an inflation surge, and as the US Federal Reserve began to aggressively hike interest rates after failing to recognize the threat earlier, the S&P 500 dropped to a low of 3,491.58.
- Optimism about interest rate reductions, which have mostly failed to materialize to the point markets anticipated, and the AI wave propelled the S&P 500 to within new record highs, before the US tariff threat dropped the S&P 500 to a low of 4,835.04.
- The S&P 500 embarked on a tremendous recovery, and the most recent record intra-day high of 6,227.60 is likely to see more upside revisions before a correction, like the events before the 50% correction during the global financial crisis of 2008.
- Price action formed a bullish price channel, which has guided the S&P 500 higher, confirming a bull market.
- The Bull Bear Power Indicator shows a negative divergence, a warning sign that the health of the rally is under threat.
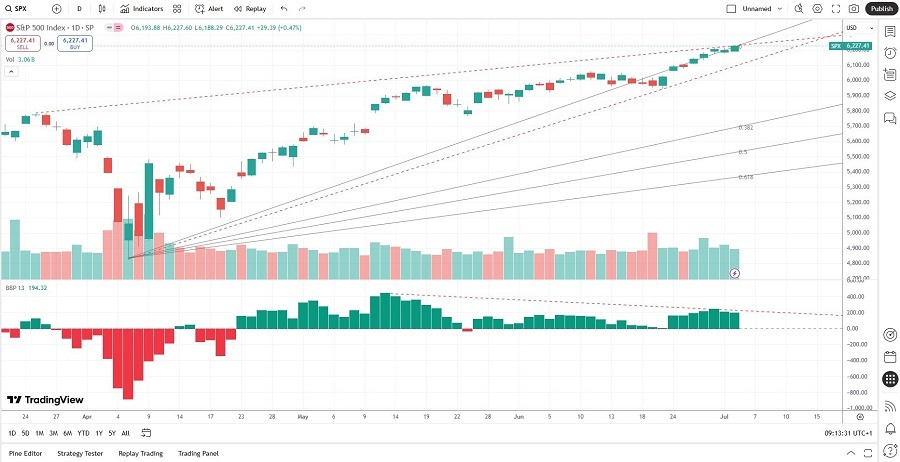
Here is a snapshot of the S&P 500 following its tariff sell-off to new records:

S&P 500 Index: Post-Tariff Panic Recovery
Here is what you should know:
- Despite headwinds, the S&P 500 has climbed a wall of worry, as evident by price action moving higher along the 0% ascending Fibonacci Retracement Fan level.
- The S&P 500 also shows a rising wedge formation, a bearish chart pattern.
- The ascending support and resistance levels of the rising wedge converge at the 6,287.86 level, which adds pressure for a breakout or breakdown.
- The Bull Bear Power Indicator shows a negative divergence but remains bullish.
What are the bullish fundamental factors?
- The AI wave has more room to push stocks higher.
- Cautious optimism about a thawing in the US-China trade war.
- The “TACO” trade, an acronym for “Trump Always Chickens Out,” remains in play.
What are the bearish fundamental factors?
- The government and personal debt continue to expand.
- Inflation remains sticky.
- Interest rates are unlikely to decrease much further, threatening debt-heavy tech darlings.
- Markets remain overly optimistic about the prospects of AI tech stocks.
- The economy has slowed, raising stagflation risk, with subdued growth ahead.
- Valuations are excessive, and vulnerable to earnings / outlook disappointments in the second half.
- Consumers show cracks in their spending appetite.
- A volatile first half is often the precursor for a challenging second half.
My Take
How should you trade the S&P 500 Index in the second half of 2025? The answer depends on what type of trader you are. If you prefer to follow trends and momentum and won’t second-guess every trend-following opportunity that shows up, you will want to be long of the S&P 500 Index and use a trailing stop.
When the S&P 500 Index rises to new record highs, it usually goes on to rise by at least a few percentage points, and this can be seen plainly by looking at historic price data.
On the other hand, you might be the type of trader that does not want to follow a trend unless you believe in it, and in this case, I have presented reasons why a medium-term correction is likely to happen this year. Should stagflation take hold, a bear market will follow any correction. The second-quarter earnings season could dictate third-quarter price action.
A correction from all-time highs to the 61.8% ascending Fibonacci Retracement Fan level is likely, given the headwinds. It would place the S&P 500 into the 5,500 to 5,600 area. A breakout above the rising wedge could pressure the S&P 500 towards 6,500, from where I would anticipate a correction.
Despite my view of what is likely to happen, as a trend trader I hold a long position in the S&P 500 Index as it is breaking to new highs, and I will continue to hold it until the trailing stop I use stops me out.
Ready to trade our S&P 500 forecast for the second half of 2025? Check out our list of the top 10 Forex brokers in the world.
