Market Index Analysis
- Starbucks (SBUX) is a member of the NASDAQ 100, S&P 100, and the S&P 500.
- All three indices are at or near record highs with rising bearish pressures and futures suggesting a sell-off.
- The Bull Bear Power Indicator of the NASDAQ 100 shows a negative divergence, and half of a reversal chart pattern has formed.
Market Sentiment Analysis
After Congress passed President Trump’s Megabill, he wasted no time in intensifying his tariff war, shifting the goalposts again. President Trump warned countries that align themselves with BRICS and threatened an additional 10% tariff. US Treasury Secretary Bessent confirmed that tariffs will revert to the April 2nd level on August 1st for all countries that fail to reach a trade deal. The rapidly expanding private credit market, now worth over $1.7 trillion, raises concerns as the trigger for a global financial crisis, adding to longer-term issues for the bull market.
Starbucks Fundamental Analysis
Starbucks is the world’s largest coffeehouse chain and affiliated with the second wave of global coffee culture. The company serves customers in 80 countries from over 35,700 stores.
So, why am I bearish on SBUX at current levels?
Competition from China is threatening Starbucks, and the trend remains in its infancy. It is also losing customers over rising costs, while trying to attract high-end spenders. The current economic climate, high inflation, and decreasing discretionary spending power make Starbucks one of the victims of consumer downgrades. The coffee competition is heating up, and Starbucks’ balance sheet issues could burn bullish investors.
|
Metric |
Value |
Verdict |
|
PE Ratio |
34.34 |
Bullish |
|
PB Ratio |
2.95 |
Bearish |
|
PEG Ratio |
2.50 |
Bearish |
|
Current Ratio |
0.64 |
Bearish |
|
ROIC-WACC Ratio |
Positive |
Bullish |
Starbucks Fundamental Analysis Snapshot
The price-to-earning (PE) ratio of 34.34 makes SBUX a comparatively cheap stock. By comparison, the PE ratio for the NASDAQ 100 is 40.70.
The average analyst price target for SBUX is 92.95, which suggests minimal downside potential from current levels. Given the rising bearish trends, I can envision downgrades.
Starbucks Technical Analysis
Today’s SBUX Signal

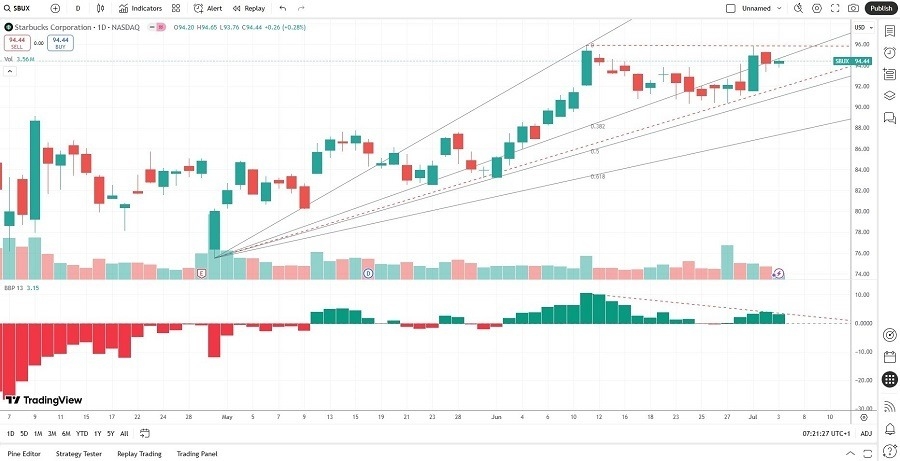
SBUX Daily Price Chart
- The SBUX D1 chart shows a double top formation, a bearish chart pattern.
- It also shows a breakdown below the 38.2% Fibonacci Retracement Fan level.
- Another breakdown could trigger a more massive correction.
- The Bull Bear Power Indicator is bullish but shows a downtrend.
- SBUX did not participate in the equity market rally, a strong bearish indicator.
My Call
I am taking a short position in SBUX between 92.00 and 95.91. While equity markets rallied to highs, Starbucks drifted lower before advancing to form a double top. The current market backdrop and macroeconomic picture suggest more selling pressure ahead. Starbucks’s trend with consumers and competition from China magnify bearish developments.
- SBUX Entry Level: Between 92.00 and 95.91
- SBUX Take Profit: Between 75.50 and 80.20
- SBUX Stop Loss: Between 99.75 and 102.68
- Risk/Reward Ratio: 2.13
Ready to trade our daily signals? Here is our list of the best stock trading platforms worth checking out.
