Bearish view
- Sell the AUD/USD pair and set a take-profit at 0.6400.
- Add a stop-loss at 0.6650.
- Timeline: 1-2 days.
Bullish view
- Buy the AUD/USD pair and set a take-profit at 0.6650.
- Add a stop-loss at 0.6400.

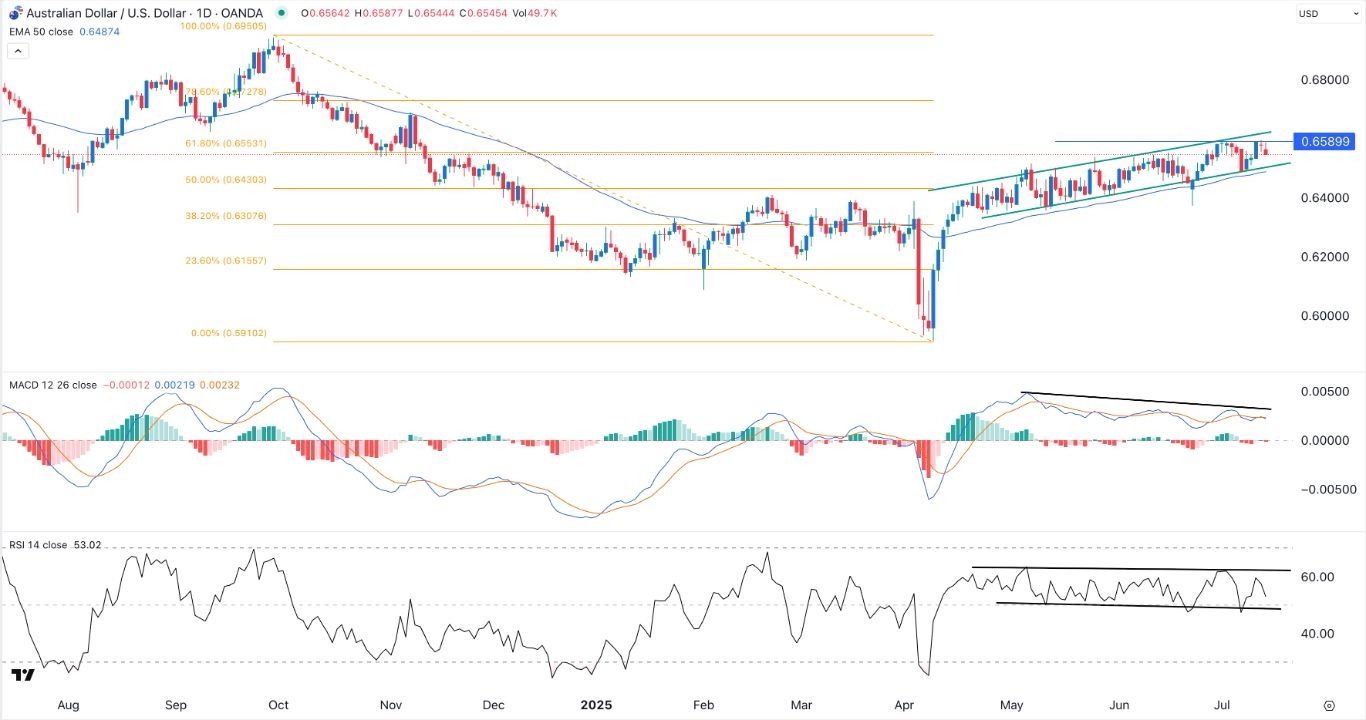
The AUD/USD exchange rate has remained in a tight range in the past few months as investors assess the impact of Donald Trump’s tariffs on inflation. It was trading at 0.6547 on Tuesday, down slightly from the year-to-date high of 0.6590.
US Inflation Data Ahead
The AUD/USD pair will be in focus on Tuesday as the US Bureau of Labor Statistics (BLS) publishes the latest consumer price index (CPI) data, which will set the tone for the US monetary policy in the next few months.
Economists expect these numbers to show that US inflation continued to rise in June as companies adjusted their prices to reflect the impact of tariffs. The consensus is that the headline Consumer Price Index (CPI) rose from 2.4% in May to 2.7% in June.
Similarly, analysts expect the core inflation, which excludes the volatile food and energy prices, rose from 2.8% in May to 3.0% in June. If these numbers are accurate, they will mean that the US inflation was moving further away from the Federal Reserve’s target of 2.0%.
Combined with the strong US nonfarm payrolls (NFP) data, these numbers will lower the odds that the Federal Reserve will cut interest rates soon. Jerome Powell and other officials have insisted that they would have cut rates earlier this year if Trump had not introduced tariffs.
The numbers come amid concerns that Trump will work to undermine Powell. He is considering firing him, citing the ongoing renovation of the bank’s building that will cost $2.5 billion. Another option is to hire a shadow Fed Chair.
The next key catalyst for the AUD/USD pair will be the upcoming statements by some Fed officials, like Michael Barr and Michele Bowman.
AUD/USD Technical Analysis
The daily chart shows that the AUD/USD exchange rate bottomed at 0.5910 in April and then bounced back to a high of 0.6590. Most recently, it has formed an ascending channel whose upper and lower sides connect the lowest swings since April.
The pair has remained at the 61.8% Fibonacci Retracement levels. It has remained above the 50-day Exponential Moving Average (EMA). However, the Relative Strength Index (RSI) has formed a descending channel. The MACD indicator has formed a bearish divergence pattern.
The most likely scenario is where the pair remained in this channel in the near term. It will then have a bearish breakdown and move to the psychological point at 0.6400. A move above the resistance at 0.6590 will invalidate the bearish view.
Ready to trade our daily Forex analysis? Check out the best forex trading platform for beginners Australia worth using.
Crispus Nyaga is a financial analyst, coach, and trader with more than 8 years in the industry. He has worked for leading companies like ATFX, easyMarkets, and OctaFx. Further, he has published widely in platforms like SeekingAlpha, Investing Cube, Capital.com, and Invezz. In his free time, he likes watching golf and spending time with his wife and child.
