Nasdaq iShares Biotechnology ETF – IBB (one-day) Elliott Wave technical analysis Daily chart Function: Major Trend. Mode: Motive. Structure: Triangle. Position: Wave 1 of [5]. Direction: Uptrend. Details: The wave…
QCOM Elliott Wave technical analysis Function: Trend. Mode: Impulsive. Structure: Motive. Position: Wave {iii} of 1. Direction: Upside in wave 1. Details: A wave {i}-{ii} structure appears completed, setting the stage…
Ultratech Cement Elliott Wave technical analysis Function: Counter Trend. Mode: Corrective. Structure: Navy Blue Wave 2. Position: Gray Wave 5. Direction next higher degrees: Navy Blue Wave 3. Details: Navy blue…
ASX: BLOCK, INC – XYZ (SQ2) Elliott Wave technical analysis Our latest Elliott Wave analysis focuses on the Australian Stock Exchange (ASX) and highlights BLOCK, INC…
EUR/USD Analysis Summary Today Overall Trend: Neutral stance with an upward bias. Today’s Euro/Dollar Support Levels: 1.1300 – 1.1240 – 1.1150. Today’s Euro/Dollar Resistance Levels:…
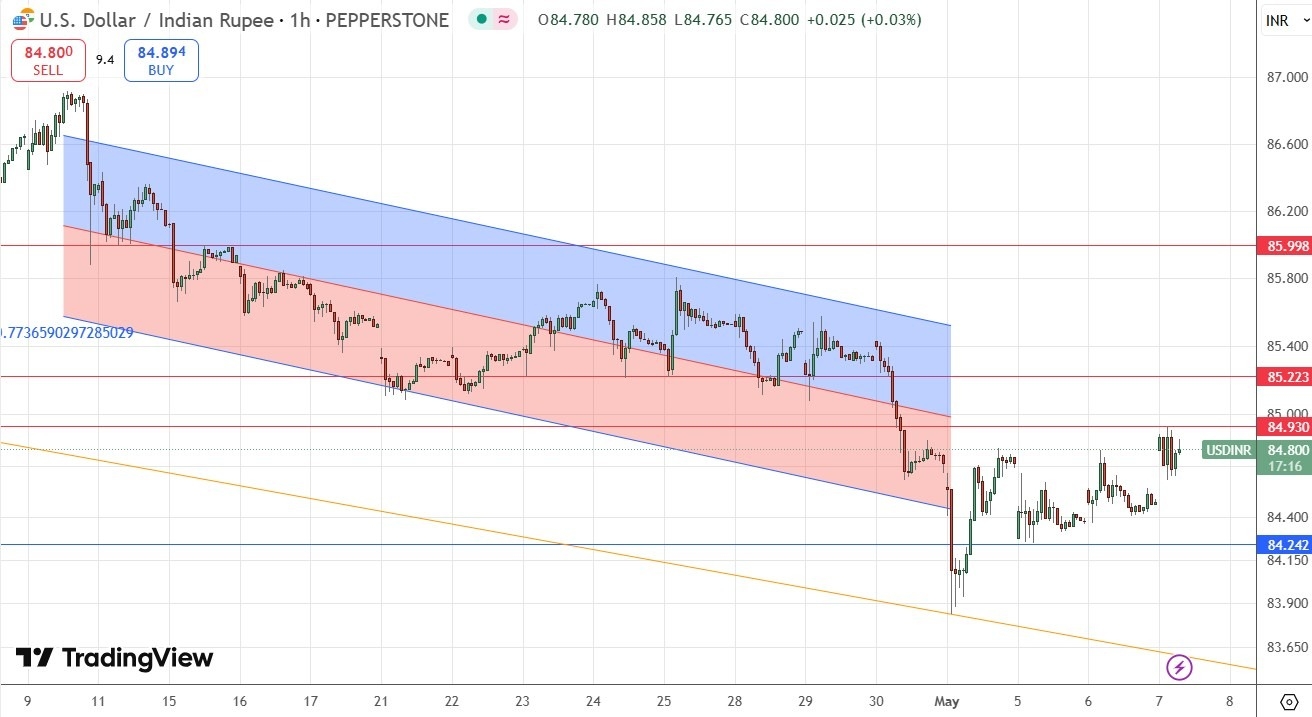
Long Trade Idea Long entry after a bullish price action reversal on the H1 timeframe following the next touch of ₹84.22. Place the stop loss…
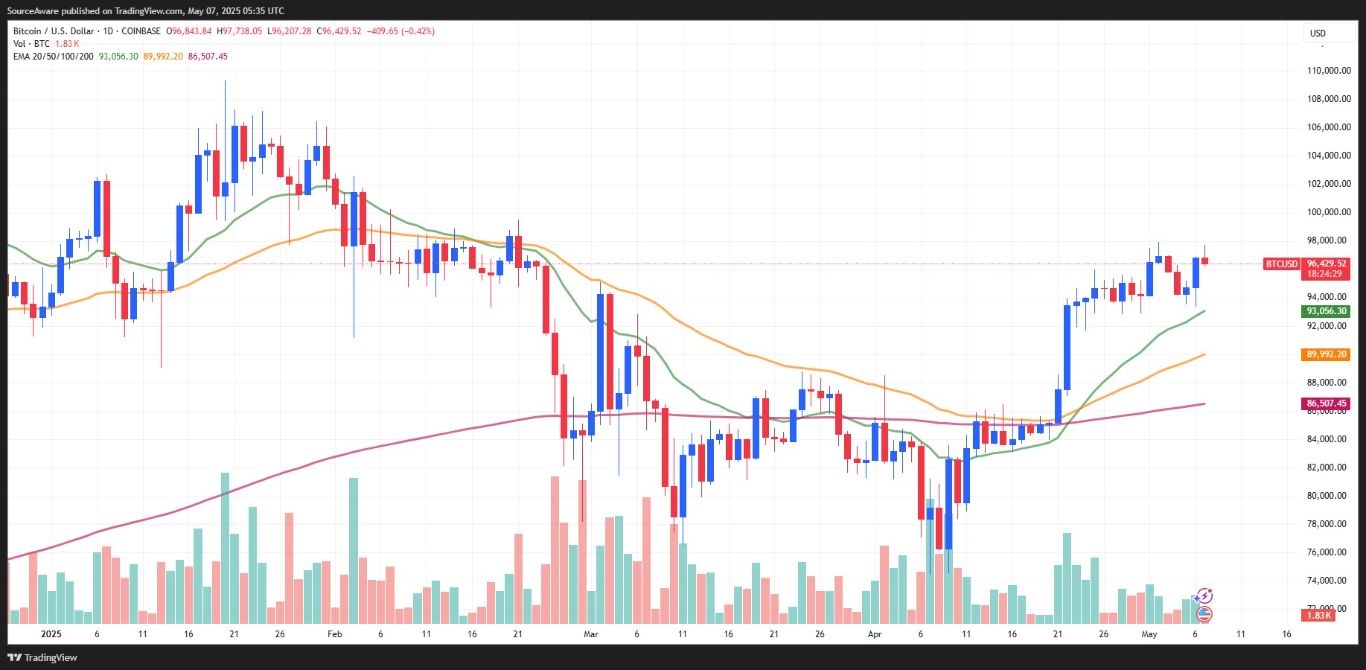
Data provided by TradingView shows that Bitcoin (BTC) bulls have their sights set on breaking above resistance at $98,000, but bears aren’t relinquishing control without…
Trust Amplify Junior Silver Miners ETF – SILJ (one-day) Elliott Wave technical analysis Daily chart Function: Major Trend. Mode: Motive. Structure: Impulse. Position: Wave [iii] Navy. Direction: Rally. Details: Wave…
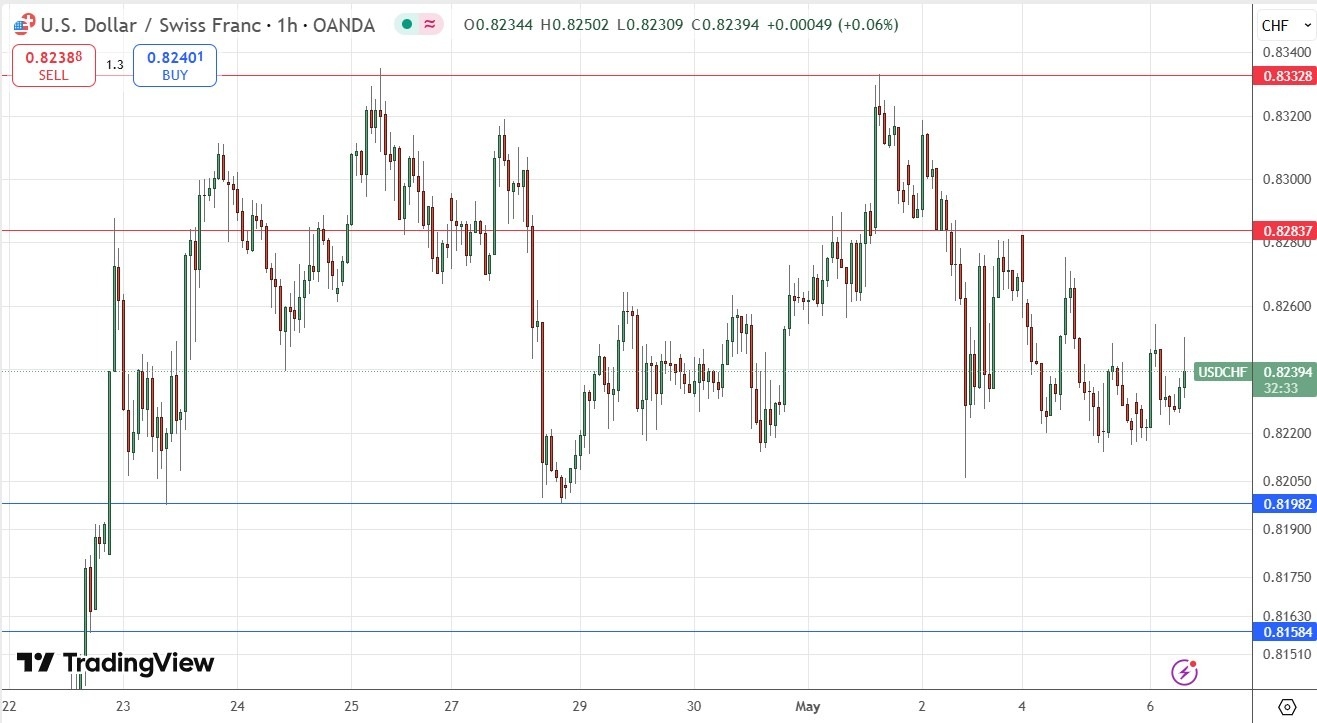
Long Trade Idea Long entry after a bullish price action reversal on the H1 timeframe following the next touch of $0.8198 or $0.8158. Put the…
EICHER MOTORS Elliott Wave technical analysis Function: Bullish Trend. Mode: Impulsive. Structure: Orange Wave 3. Position: Navy Blue Wave 5. Direction next lower degrees: Orange Wave 4. Details:…

![Nasdaq iShares Biotechnology ETF – IBB Elliott Wave technical analysis [Video] Nasdaq iShares Biotechnology ETF – IBB Elliott Wave technical analysis [Video]](https://editorial.fxsstatic.com/images/i/Equity-Index_Nasdaq-1_Large.jpg)
![QCOM Elliott Wave technical analysis [Video] QCOM Elliott Wave technical analysis [Video]](https://editorial.fxsstatic.com/images/i/stock-01_Large.jpg)
![Ultratech Cement – ULTRACEMCO Elliott Wave technical analysis [Video] Ultratech Cement – ULTRACEMCO Elliott Wave technical analysis [Video]](https://editorial.fxsstatic.com/images/i/Housing_3_Large.png)
![BLOCK, INC – XYZ (SQ2) Elliott Wave analysis and Elliott Wave technical forecast [Video] BLOCK, INC – XYZ (SQ2) Elliott Wave analysis and Elliott Wave technical forecast [Video]](https://editorial.fxsstatic.com/images/i/car-industry-01_Large.jpg)


![Trust Amplify Junior Silver Miners ETF – SILJ Elliott Wave technical analysis [Video] Trust Amplify Junior Silver Miners ETF – SILJ Elliott Wave technical analysis [Video]](https://editorial.fxsstatic.com/images/i/windows-02_Large.jpg)

![EICHER MOTORS Elliott Wave technical analysis [Video] EICHER MOTORS Elliott Wave technical analysis [Video]](https://editorial.fxsstatic.com/images/i/car-industry-02_Large.jpg)