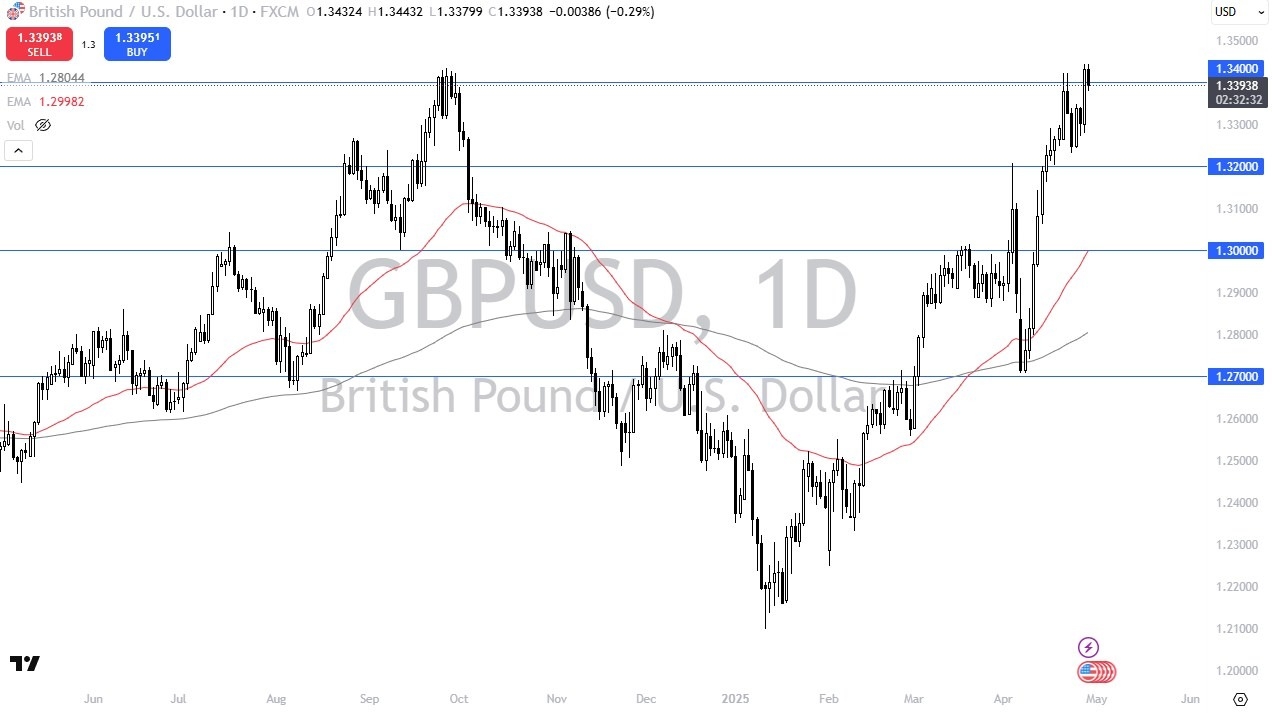
Created on April 30, 2025 The British pound pulled back just a bit during the trading session on Tuesday as we are hanging around the…
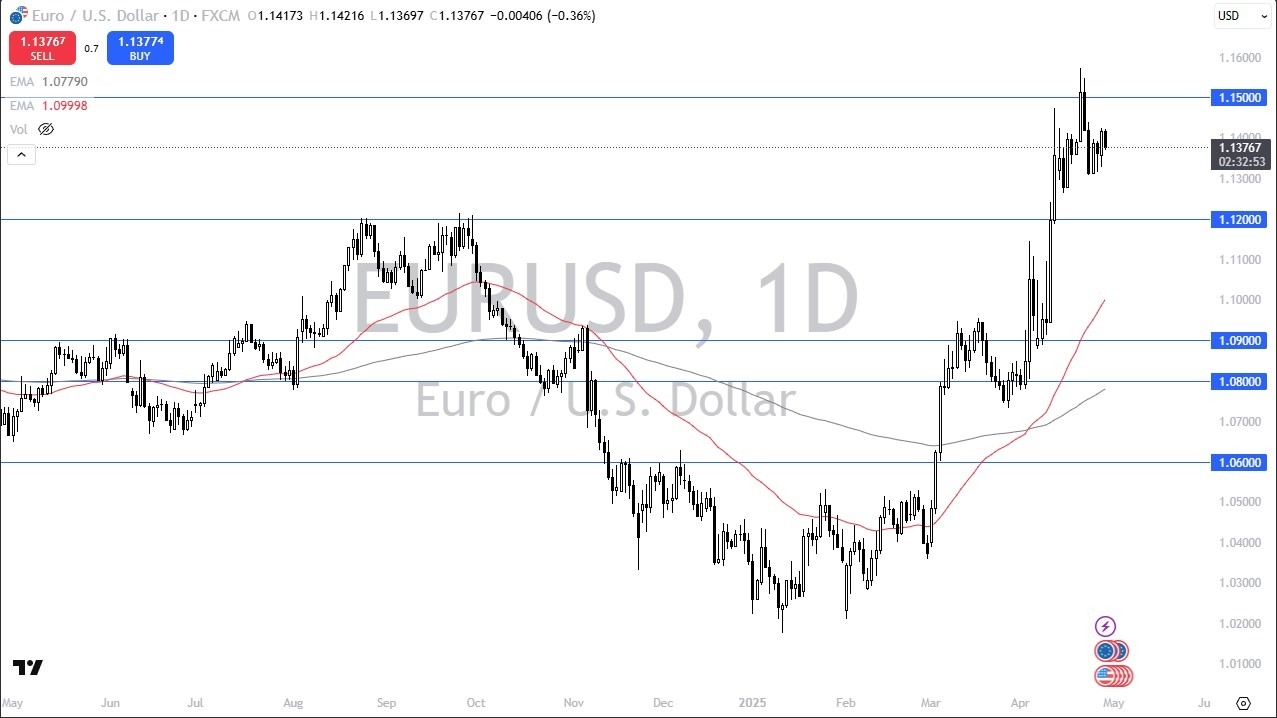
Created on April 30, 2025 The Euro was a bit negative during the trading session on Tuesday. Again, as we continue to see a lot…
VanEck Rare Earth & Strategic Metals ETF (REMX) – Elliott Wave technical analysis Daily chart – Expanded flat correction nearing completion Function: Counter trend. Mode: Corrective. Structure: Expanded…
JSW STEEL Elliott Wave technical analysis Function: Counter Trend. Mode: Corrective. Structure: Orange Wave 2. Position: Navy Blue Wave 1. Directions next higher degrees: Orange Wave 3. Details: Orange wave 1 appears complete; orange…
S&P BSE SENSEX NEXT 50 Wave technical analysis Function: Counter Trend. Mode: Corrective. Structure: Orange Wave 2. Position: Navy Blue Wave 3. Direction next higher degrees: Orange Wave 3. Details: Orange wave 1 appears…
Elliott Wave technical analysis – (daily chart) Today’s Elliott Wave update focuses on CAR GROUP LIMITED (ASX: CAR). Our current outlook indicates that the stock might have…
Watch the video from the WLGC session on 29 Apr 2025 to find out the following: Has the market officially reversed, or is this just…
Nike (NKE) shows a bearish trend that began at its peak on November 8, 2021, indicating potential for further declines. On a shorter cycle, the…
Kenny Polcari breaks down everything you need to know as markets brace for a massive week of earnings, key economic data, and geopolitical uncertainty. Stocks…
SILJ Elliott Wave analysis Function: Major Trend. Mode: Motive. Structure: Impulse. Position: Wave [iii] Navy. Direction: Rally. Invalidation level: $10.01. Details: Wave 3 is nearing its strongest part – the third of…


![VanEck Rare Earth & Strategic Metals ETF (REMX) – Elliott Wave technical analysis [Video] VanEck Rare Earth & Strategic Metals ETF (REMX) – Elliott Wave technical analysis [Video]](https://editorial.fxstreet.com/images/i/bullish-line_Large.png)
![JSW STEEL Indian Stocks Elliott Wave technical analysis [Video] JSW STEEL Indian Stocks Elliott Wave technical analysis [Video]](https://editorial.fxsstatic.com/images/i/General-Stocks_2_Large.png)
![S&P BSE SENSEX NEXT 50 (India) Wave technical analysis [Video] S&P BSE SENSEX NEXT 50 (India) Wave technical analysis [Video]](https://editorial.fxsstatic.com/images/i/SP500-bullysh-withoutbull_Large.jpg)
![Car Group Limited – CAR Elliott Wave technical analysis [Video] Car Group Limited – CAR Elliott Wave technical analysis [Video]](https://editorial.fxsstatic.com/images/i/charts-02_Large.jpg)
![This rally might end in pain — But first, there’s room to run [Video] This rally might end in pain — But first, there’s room to run [Video]](https://editorial.fxsstatic.com/images/i/Economic-Indicator_Recession-5_Large.png)
![Nike rally to fail in seven-swing pattern [Video] Nike rally to fail in seven-swing pattern [Video]](https://editorial.fxsstatic.com/images/i/LTC-bearish-line_Large.png)
![Earnings, inflation, and tariff turmoil [Video] Earnings, inflation, and tariff turmoil [Video]](https://editorial.fxsstatic.com/images/i/US-PCE-inflation_Large.png)
![SILJ Elliott Wave technical analysis [Video] SILJ Elliott Wave technical analysis [Video]](https://editorial.fxsstatic.com/images/i/General-Stocks_3_Large.png)