Markets (and the emotional reaction to markets) never cease to amaze me. I’ve been doing this for almost 24 years now, I’ve been through four major bear markets, 2 catastrophic market crashes, and countless corrections and pullbacks – but one thing never seems to change… the emotional and behavioral reaction to the markets by investors.
Sentiment indicators during the bottom of the Tariff Crash were suggesting investors were more fearful than they were during the COVID crash. Let’s say that again, but differently…
At the bottom of the Tariff Crash, investors were more fearful than they were during a 100-year pandemic that forced people to stay in their homes, businesses to close for weeks, and many companies never, ever re-opened. Does that make any sense at all?!
Alright – I digress…
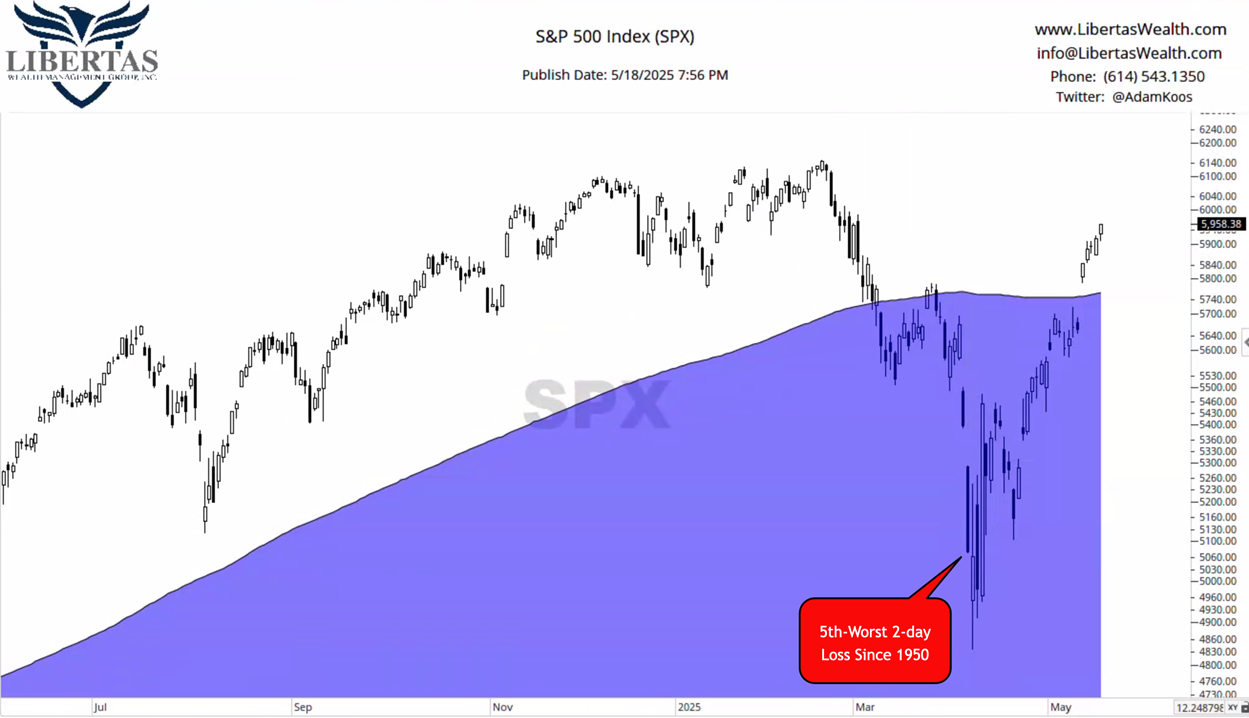
My point is, the Tariff Crash was an emotional, news-driven market correction, and crashes like these tend to produce V-bottoms.
In fact, I’ve marked the bottom of the two-day decline in April that ranked as the 5th-worst drop in the stock market since 1950. Since that day (not the closing low of the tariff crash – but the closing bottom of the 2-day record move), the S&P500 is up around 17.5%.
While it’s entirely possible that we see a re-test of those lows this summer, the likelihood of such a drop is getting smaller and smaller with each passing day.

There is still a lot of talk about international markets outpacing the U.S., and if you have a short-term timeframe, you’d be correct. For me, however, I manage portfolios for our clients using an intermediate-term timeframe, and I need more time to pass before a longer-term trend takes hold – or said another way, I need this out-performance of international stocks to “prove itself.”
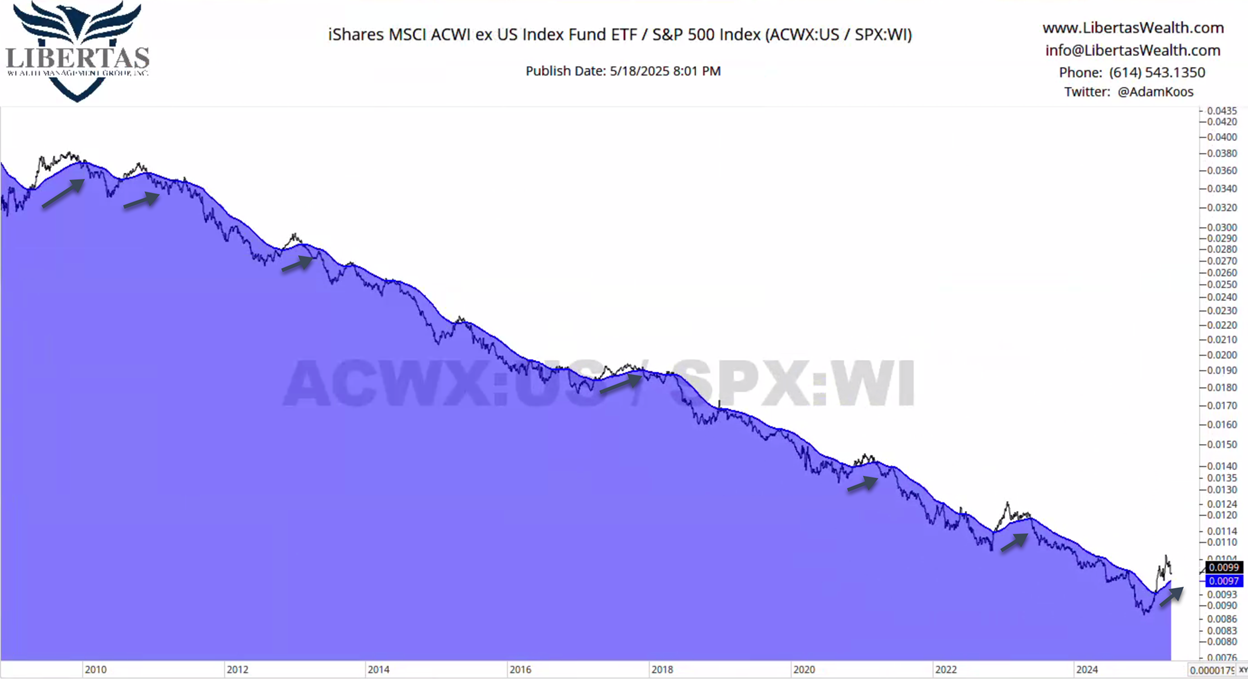
If you take a look at the chart below, I’ve plotted the All-Country World Index Ex-U.S. (ACWX) vs. the S&P500, along with a 150-day moving average in blue. When price (and the moving average) are trending up, international stocks are in favor… and when it’s trending down, domestic stocks are in favor.
It’s pretty clear to me that international stocks have been under-performing the U.S. for quite some time. This is the 7th time since the bottom of The Great Recession that the 150-day moving average on the RS chart can be seen significantly trending upward, but each and every time (at least so far), it’s only failed and headed lower again.
(Nerds Note: One could argue that, in spring of 2015, the 150MA sloped upward, but it was so slight and for such a short period of time, I decided to omit the occurrence).

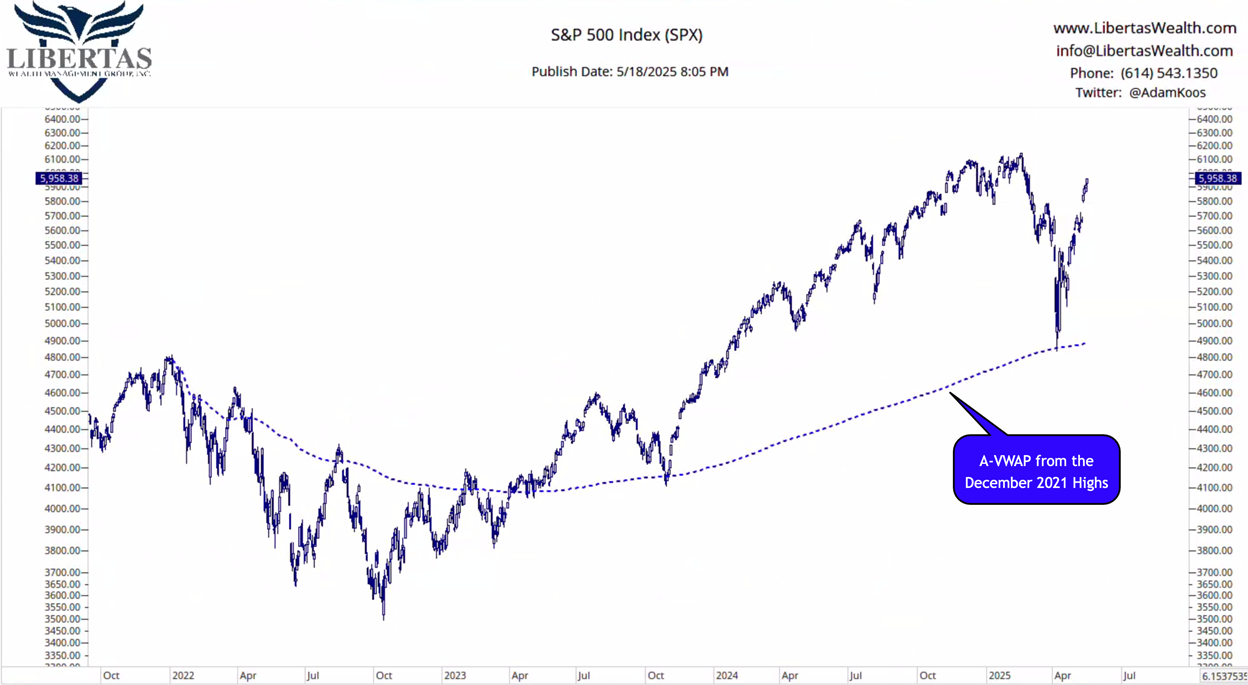
The Anchored Volume Weighted Average Price (A-VWAP) is the average price, weighted by volume, paid by market participants since a selected point / date in the past.
Invented and made famous by my friend and fellow Chartered Market Technician, Brian Shannon, when plotted correctly on a chart, it can provide interesting and actionable potential floors of support and ceilings of resistance.
One of the levels I was watching during the last few months was the A-VWAP from the December 2021 market highs:
- It acted as a ceiling of resistance throughout the 2022 bear market,
- A floor of support during the fall 2023 correction, and
- The S&P500 tapped the same level, intra-day, at the bottom of the Tariff Crash.
Technical analysis is truly incredible…

Unlock exclusive gold and silver trading signals and updates that most investors don’t see. Join our free newsletter now!

