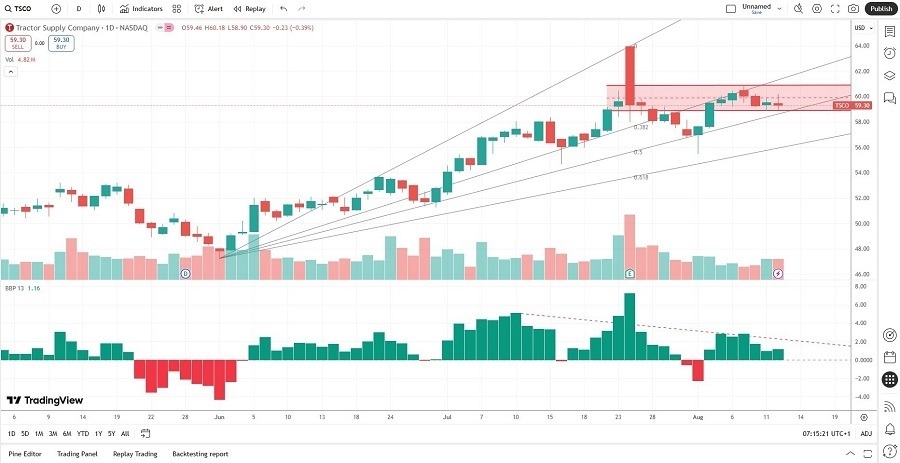
Short Trade Idea
Enter your short position between 58.98 (the lower band of its horizontal resistance zone) and 60.80 (the lower band of its horizontal resistance zone).
Market Index Analysis
- Tractor Supply (TSCO) is a member of the S&P 500
- This index continues to reflect record highs, but trading volumes remain bearish
- The Bull Bear Power Indicator of the S&P 500 shows a negative divergence
Market Sentiment Analysis
Equity markets recorded fresh all-time highs after the CPI report triggered widespread optimism for a September interest rate cut. Market participants chose to ignore the rising core CPI and opted to celebrate the in-line headline inflation. It resembles market behavior in the summer before the global financial crisis. While tariffs generated record revenues in July, the trade deficit also increased. It is premature to celebrate victory on the inflation front, and traders should exercise caution as equity markets climb a wall of worry.
Tractor Supply Fundamental Analysis
Tractor Supply is an agriculture, lawn and garden maintenance, livestock, equine, and pet retailer with over 2,200 stores and expansion plans to reach 3,000 store locations. It is also a Fortune 500 company.
So, Why Am I Bullish on TSCO After Its Post-Earnings Sell-off?
Tractor Supply is on an ambitious expansion plan, but valuations are too high for me, while flat same-store sales raise a significant red flag. TSCO has rallied over the past year despite a decrease in revenues and earnings per share, but investors finally pulled the plug after the latest earnings disappointment. Input costs continue to rise amid a slowing economy, and an interest rate cut will not resolve the issue.
Tractor Supply Fundamental Analysis Snapshot

The price-to-earnings (P/E) ratio of 29.21 makes TSCO an expensive stock. By comparison, the P/E ratio for the S&P 500 is 29.41.
The average analyst price target for TSCO is 62.59. It suggests limited upside potential, with rapidly rising downside risks.
Tractor Supply Technical Analysis
Today’s TSCO Signal

- The TSCO D1 chart shows price action inside a horizontal resistance zone
- It also shows price action between its descending 38.2% and 50.0% Fibonacci Retracement Fan level following a breakdown
- The Bull Bear Power Indicator is bullish, but has been decreasing with a descending trendline
- The average bearish trading volumes are higher than the average bullish trading volumes
- TSCO corrected as the S&P 500 moved higher, a significant bearish trading signal
My Call
I am taking a short position in TSCO between 58.98 and 60.80. I believe flat same-store sales and negative revenue and earnings per share growth, with higher input costs, will drive the share price lower and towards reasonable valuations.
- TSCO Entry Level: Between 58.98 and 60.80
- TSCO Take Profit: Between 47.24 and 51.28
- TSCO Stop Loss: Between 62.59 and 63.99
- Risk/Reward Ratio: 3.25
Ready to trade our free daily signals? Here is our list of the best brokers for trading worth checking out.
