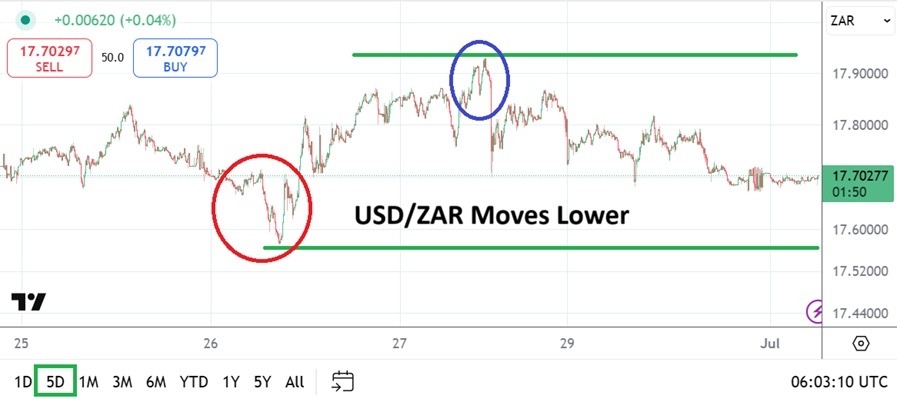
The USD/ZAR is around the 17.70400 vicinity at the time of this writing and has shown an ability to test support levels as its rather solid bearish trend continues to show solid sentiment.

USD centric weakness has helped the USD/ZAR maintain its rather strong bearish momentum lower and as of this writing the currency pair is near the 17.70400 mark with quick value changes being demonstrated. Support levels continue to be tested and last Thursday a low around the 17.57000 ratio was battled. This might beg the question why the currency pair is now higher if a bearish trend is claimed, but day traders need to always understand reversals upwards are a part of Forex.
The USD/ZAR was trading near the 17.92700 ratio on Friday, this after Thursday’s spark lower. Reactions to solid mid-term lows being tested produced reactionary buying. And what we are left with as of this morning is a USD/ZAR which has traversed lower again and is now testing an important one month technical ground.
Financial Institutions and Inflection Points in the USD/ZAR
The 17.70000 when looked at by speculators can be interpreted as a key inflection point. The value has worked as a lower price realm for nearly a month. The USD/ZAR is trading again near prices it traversed in the second week of December. While the USD has been weak in the broad Forex market and many major currencies are producing long-term stronger values, the South African Rand is merely testing mid-term lows.
It appears that financial institutions in South Africa continue to have some domestic concerns about South Africa’s fiscal management. The coalition government does seem to be holding, but for the USD/ZAR to make another strong bearish track lower there appears to be impetus needed. The U.S jobs numbers will be published this Thursday because of the July 4th holiday in the States. But also there is a shadow being cast by U.S domestic politics regarding its budget legislation. Until clarity is delivered, risk appetite may remain somewhat muted, which may mean the USD/ZAR continues to languish within its known range.
Testing the USD/ZAR 17.70000 Near-Term Ratio
Day traders may want to stay focused on the 17.70000 ratio as a place where financial institutions in the may become active. The support ratio has continued to be a lynchpin technically the past month and may continue to provide a place that speculators should view as an opportunity. Is the 17.70000 support level about to crumble?
- Yes, the USD/ZAR did break below this level last week, but its rapid pace upwards after attaining significant lows is a reminder the currency pair can be volatile.
- If trading is sustained below the 17.70000 for a day or two that could mean financial institutions may believe lower values are now the target, but until then day traders may technically want to use the level as a place to try quick hitting tests of momentum.
- It does appear that the USD/ZAR at price levels above the 17.71000 to 17.72000 levels may appear to be overbought short-term.
USD/ZAR Short Term Outlook:
Current Resistance: 17.71300
Current Support: 17.69980
High Target: 17.73900
Low Target: 17.67600
Ready to trade our daily Forex analysis? Here’s a list of the best forex trading platforms South Africa to choose from.
