I wrote on 20th April that the best trades for the week would be:
- Long of the EUR/USD currency pair. Unfortunately, it fell by 0.24% over the week.
- Short of the USD/JPY currency pair. Unfortunately, it rose by 1.00% over the week.
- Long of Gold following a daily (New York) close above $3,343.10. This set up on Monday but unfortunately the price then fell by 3.06% over the rest of the week.
The overall result was a loss of 4.30%, which was 1.43% per asset.
Last week saw a much calmer market as we seem to have moved beyond any new tariff bombshells. Negotiations will be ongoing until the 90-day period ends in early July.
The major event of last week, which had a very light news agenda, was President Trump’s attempt at a gentle walk back of his comments blasting Jerome Powell of the Federal Reserve for not cutting rates more aggressively, which had led to a sharp fall in stock markets the previous week. Trump’s comments may have aided the recovery we saw in stock markets and in other risky assets last week.
Last week’s other major data points were:
- Flash Services & Manufacturing PMI UA, Germany, UK, France – mostly worse than expected, suggested slowing economies.
- Chair of Swiss National Bank Speech
- Canada Retail Sales – as expected.
- US Unemployment Claims – as expected.
- UK Retail Sales – this was much better than expected, showing a 0.4% month-on-month increase, when a decline of 0.3% was anticipated.
The coming week has a busy schedule of important releases, including key US economic data and a policy meeting at the Bank of Japan.
This week’s important data points, in order of likely importance, are:
- US Core PCE Price Index
- US Average Hourly Earnings
- US Non-Farm Employment Change
- German Preliminary CPI
- Australian CPI (inflation)
- US Advance GDP
- Bank of Japan Policy Rate, Monetary Policy Statement, and Outlook Report
- Canadian GDP
- Canadian Federal Election
- Australian Parliamentary Election
- US JOLTS Job Openings
- US ISM Manufacturing PMI
- US Employment Cost Index
- US Unemployment Claims
- US Unemployment Rate
- Chinese Manufacturing PMI

For the month of April 2025, I made no monthly forecast, as at the start of that month, the Forex market was dull and there were only mixed long-term trends.
As there were no unusually large price movements in Forex currency crosses over the past week, I make no weekly forecast.
The Australian Dollar was the strongest major currencies last week, while the Swiss Franc was the weakest. Volatility decreased slightly last week, with more than 33% of the most important Forex currency pairs and crosses changing in value by more than 1%. Next week will likely see more volatility as there will be a very full data schedule.
You can trade these forecasts in a real or demo Forex brokerage account.
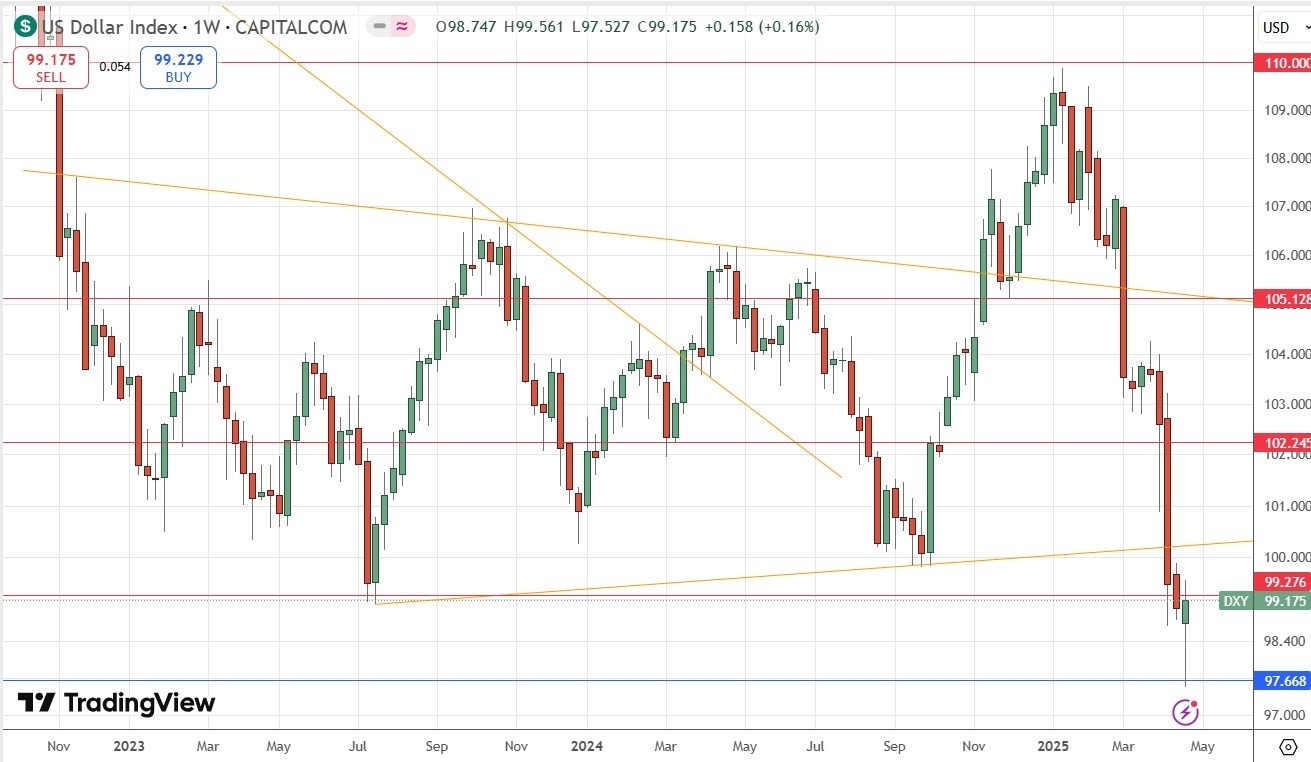
Last week, the US Dollar Index printed a bullish pin bar which closed not far from the high of its range. The price reached a new 4-year low before bouncing strongly off the support level shown in the price chart below, at 97.67. These are bullish signs, but the strong long-term bearish trend is a bearish sign, as is the fact that the price ended the week below the likely resistance level at 99.28.
It is hard to say what will happen to the US Dollar next week after this bullish bounce, but trading in line with the long-term trend will certainly look to be going short of the greenback. Much may depend on average hourly earnings and PCE Price Index data that will be released on Friday, and possibly also GDP data earlier in the week.
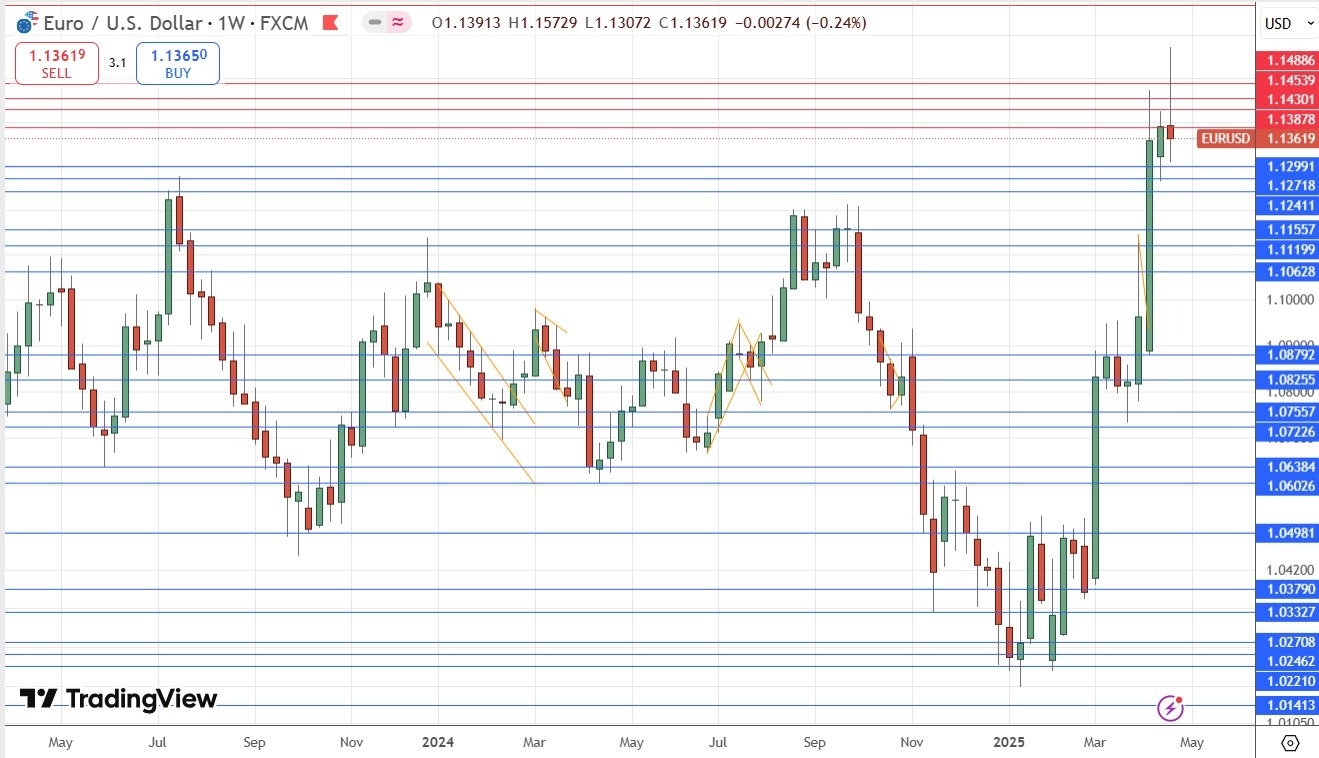
The EUR/USD currency pair rose last week to reach a new multi-year high near $1,1500, before reversing strongly to print a bearish pin bar, closing lower near the bottom of its weekly range. This is a bearish sign and suggests we may have seen a major bearish reversal. However, the long-term trend is still bullish, the price has just been trading in blue sky, and this currency pair tends to trend slowly but reliably.
So, it may still be worth being involved on the long side here, but I’d want to see a new significant bullish breakout first.
If the price can get established above $1.1517 that will probably be a good long trade entry signal, as there are no key resistance levels above that area for a few hundred pips.
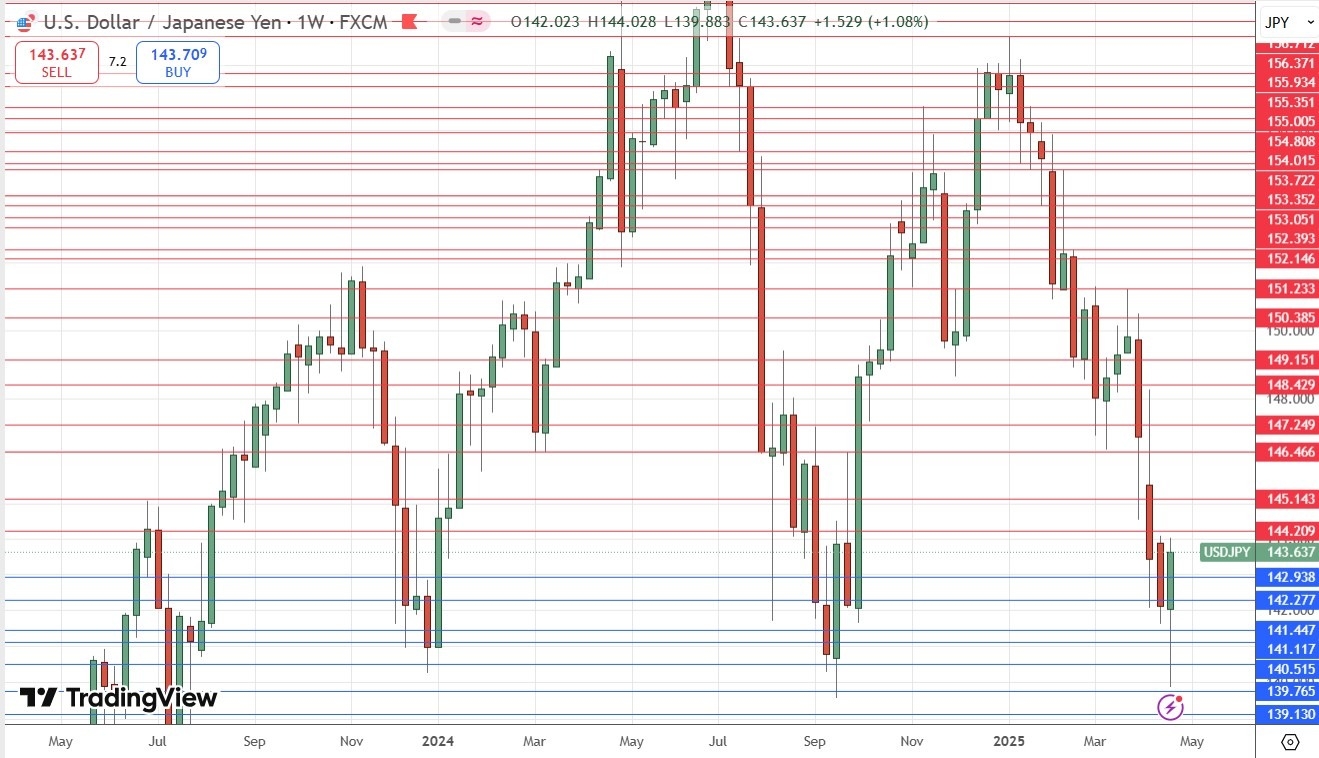
The USD/JPY currency pair fell early in the week to make another new multi-month low just below the big round number at ¥140 before making a strong bullish bounce and closing the week notably higher. The long-term trend is certainly bearish, but we may well have seen a significant bullish reversal here, with the pair advancing in tandem with stock markets, which mostly saw recoveries over the past week as the US tariffs issue seems to have been largely defused by now, at least until the July deadline starts to get very close.
This major currency pair tends to trend with some reliability, so I like to be short here, but only after we see a strong bearish reversal leading to a new multi-month daily (New York) low close below ¥140.75.
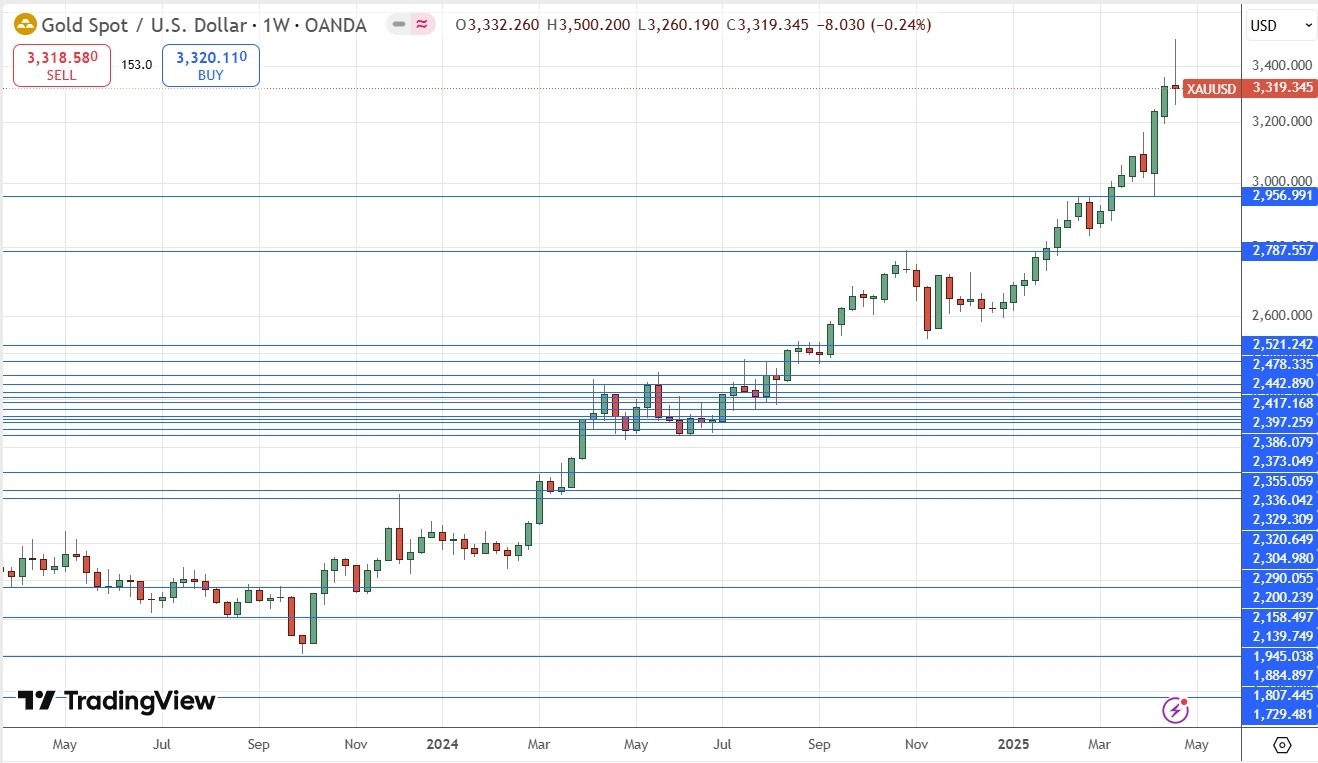
Gold rose firmly last week to reach yet another new record high just a fraction below the round number at $3,500 before falling strongly enough to shake out most trend followers from their long positions by the end of the week. The weekly close ended up forming a candlestick which was more or less a bearish pin bar, although not a very well-formed one.
Gold can advance during periods of crisis like the one we are in now and this is what seems to have happened, and this may be why we are seeing quite a strong bearish reversal as risk appetite improves as the US tariffs issue seems to have been kicked away into touch until the summer arrives.
It is worth considering Gold as having standalone merit, as a look at the weekly price chart below shows a very strong long-term bullish trend having been underway for almost 1.5 years. Since the start of 2024, the price of Gold against the USD has increased by more than 55%, which is an impressive amount for any asset, and especially so for a precious metal.
I think it is wisest to be out of Gold right now unless we see a new high daily (New York) closing price above $3,425.
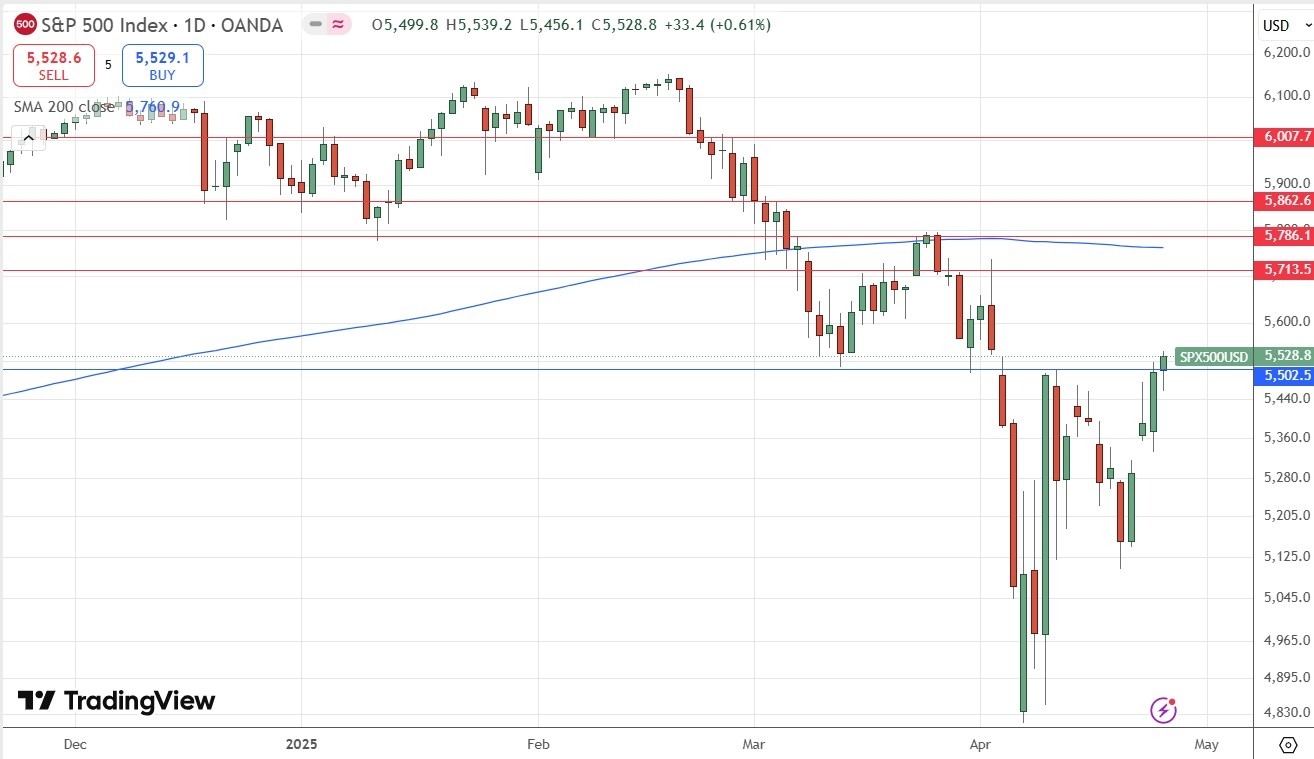
The S&P 500 Index advanced last week on improved risk sentiment. The bullish technical development is the weekly close above the pivotal point and round number at 5500.
Despite that bullish sign, it is worth noting that the price might still just be sitting below the end of the pivotal zone – one more higher close would probably be a more decisive bullish break.
On the bearish side, the price remains well below the 200-day moving average which is shown within the price chart below. The price is traded well within correction territory, having previously fallen into bear market territory.
Shorting US equity indices is very risky and probably not advisable to anyone except a very experienced trader. This is especially true as we are now seeing some signs of resilience which might see a continuing recovery until US tariffs come back into focus in June a few weeks from now.
I believe there is going to be more turbulence in the stock market over the coming months as we approach the 90-day tariff deadline in early July, so I am happy to be out of stocks for now.
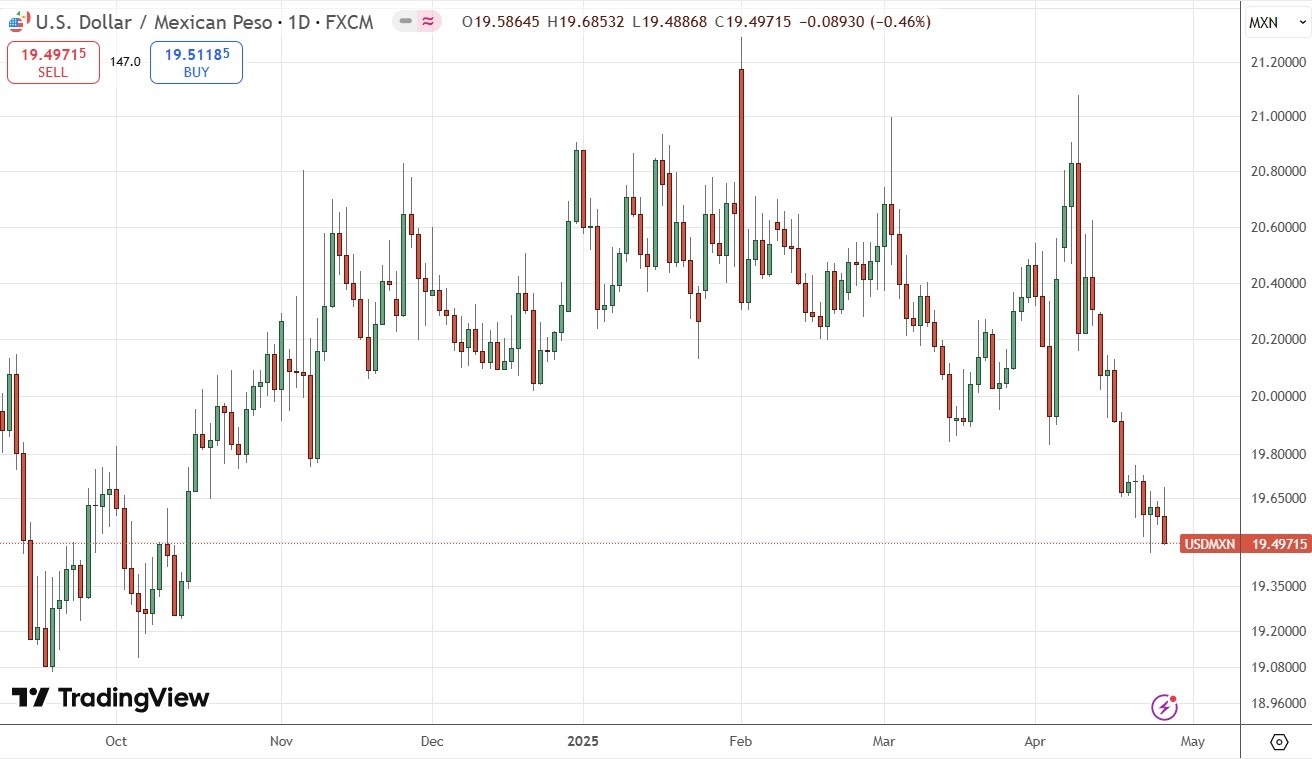
The USD/MXN currency pair has been falling for several days, even as the USD started to recover very firmly over the past week. The price ended the week at a 6-month low closing price – both this and the recent price action are bearish. There is a strongly bearish trend here over both the long and short term, which will attract traders on the short side.
Another bearish technical development is the way the price has become well and comfortably established below the big round number at 20.00.
The fundamental driver behind the strong Mexican Peso is the way the trade war between the USA and Mexico has been defused, at least for the next few weeks. Absent any sign of worse US intentions, the price is likely to continue trending lower over the coming week.
I see the best trades this week as:
- Long of the EUR/USD currency pair following a daily (New York) close above $1.1517.
- Short of the USD/JPY currency pair (New York) close below ¥140.75.
- Long of Gold following a daily (New York) close above $3,425.
- Short of the USD/MXN currency pair.
Ready to trade our Forex weekly forecast? Check out our list of the top 10 Forex brokers in the world.
