I wrote on 23rd March that the best trades for the week would be:
- Long of Gold, which rose by 2.06%.
- Long of EUR/USD following a daily close above $1.0951. This did not set up.
- Short of USD/JPY following a daily close below ¥147.26. This did not set up.
- Long of Copper futures following a daily close above $910.20. This set up on Tuesday and ended the week 2.08% lower,
The overall result was a loss of 0.02%.
Last week saw several important data releases affecting the Forex market:
- US Core PCE Price Index – this was slightly higher than expected, showing a month-on-month increase of 0.4% when an increase of only 0.3% was expected, suggesting that US inflation is running a bit stronger and decreasing the odds of rate cuts.
- US Final GDP – this was just a fraction higher than expected, at an annualized growth rate of 2.4%, while 2.3% was expected.
- UK CPI (inflation) – this came in lower than expected, at an annualized rate of 2.8% while a rate of 3.0% was widely forecasted.
- Australian CPI (inflation) – this came in lower than expected, at an annualized rate of 2.4% while a rate of 2.5% was widely forecasted.
- UK Annual Budget – no surprises.
- Canadian GDP – slightly higher than expected at a monthly increase of 0.4%, while 0.3% was expected.
- Flash Services & Manufacturing PMI for USA, Germany, UK, France – this was mixed.
- US Unemployment Claims – this was almost exactly as expected.
- UK Retail Sales – this was much better than expected, showing a 1% increase when a decline of 0.3% was expected.
Last week’s key takeaways were:
- Inflation in the USA may be running a little hotter than expected, and this has decreased the odds of rate cuts later in 2025, which in turn may have strengthened the US Dollar a little. According to the CME FedWatch tool, markets are now expecting three 0.25% rate cuts by the end of 2025. However, the PCE data on Friday, as well as new tariffs on car imports, did sink US stock markets and the USD. The US Dollar is also weak due to other factors.
- The ongoing trade war between the USA on one side and Canada, Mexico, China and potentially the European Union continues to dominate the agenda, with President Trump promising the implementation of new tariffs on 2nd April this week. This has kept the US Dollar and US stock markets relatively weak, but Trump has been careful to suggest people will be pleasantly surprised by what will be imposed on 2nd April, and until Friday, this prevented any sharp declines in the US stock market. In the last few hours, Trump has stated he is willing to make a deal on the 25% auto tariffs, and that he will be announcing pharmaceutical tariffs soon.
- Inflation in the UK and Australia was a bit lower than expected, suggesting an easing of inflationary pressures and potentially weakening these two respective currencies a little.
- Copper ended the week firmly lower off its all-time high price, but Gold continued to rise strongly at the end of the week.
- GDP in the USA and Canada was slightly higher than expected, and still relatively strongly positive.
The coming week has a slightly heavier schedule of important releases, so we may see a rise from last week’s relatively low volatility over the coming week.
This week’s important data points, in order of likely importance, are:
- US Average Hourly Earnings, Non-Farm Employment Change, and Unemployment Rate
- US JOLTS Job Openings
- Australia Cash Rate & Rate Statement
- German Preliminary CPI
- US ISM Services PMI
- US ISM Manufacturing PMI
- Swiss CPI (inflation)
- US Unemployment Claims
- Chinese Manufacturing PMI
- Canadian Unemployment Rate

For March 2025, I made no forecast, as there were no clear trends at the start of this month.
For the month of April 2025, I again make no forecast, as the Forex market is dull and there are only mixed long-term trends.
Last week, I made no weekly forecast, as there were no unusually strong movements in any weekly currency crosses.
This week, I again make no forecast.
The Australian Dollar was the strongest major currency last week, while the Japanese Yen was the weakest, although the numbers were so small as to be practically negligible. Volatility decreased last week, with fewer 4% of the most important Forex currency pairs and crosses changing in value by more than 1%. Next wee will likely see more volatility as Trump’s tariffs will be announced on Wednesday.
You can trade these forecasts in a real or demo Forex brokerage account.
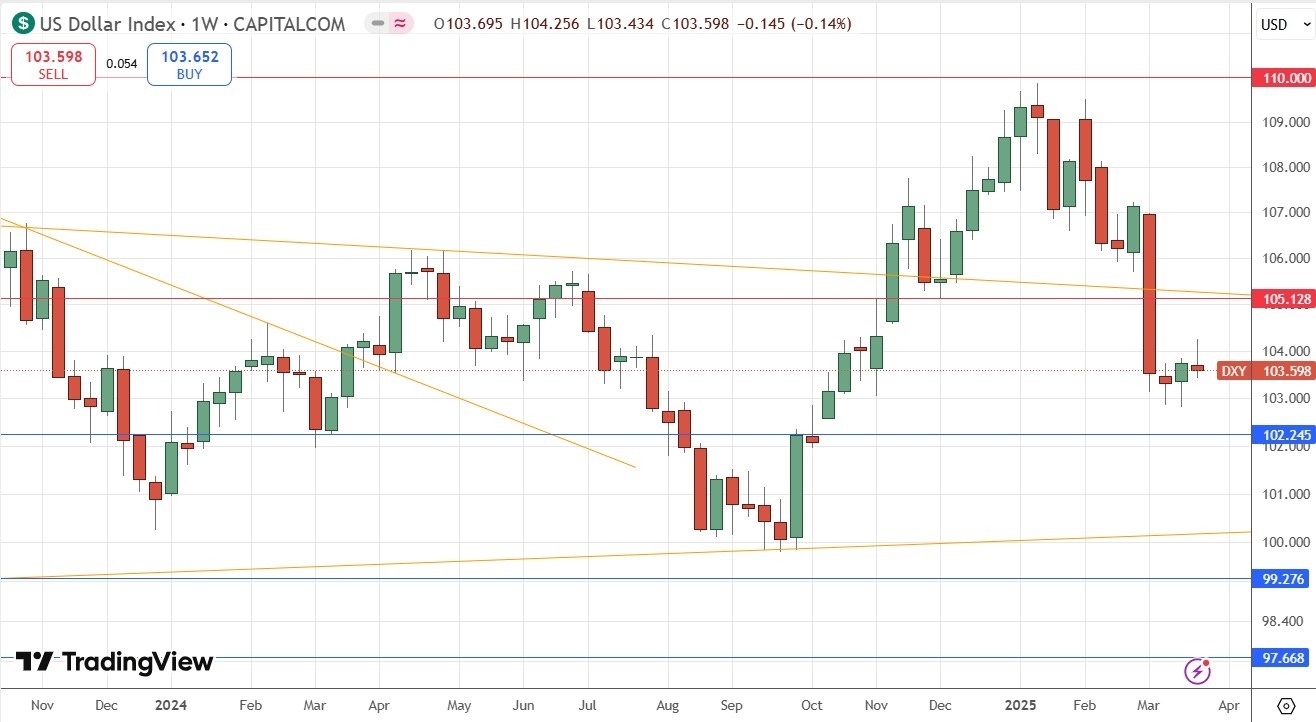
Last week, the US Dollar Index printed a small bearish pin bar. The candlestick had a very small range. Overall, there was very little movement in the Forex market last week.
The price is well below its level of 3 months ago, invalidating its former long-term bullish trend. However, the long-term trend is mixed and unclear, as the price is still above its level from 6 months ago.
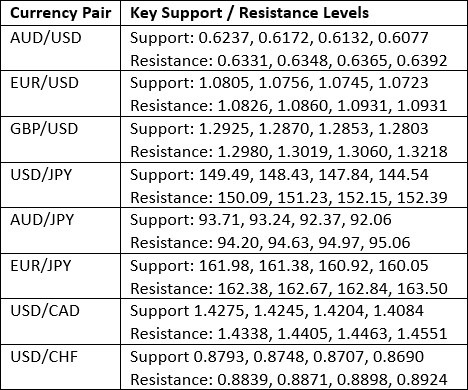
The lack of decisive direction and low range in the greenback suggests that the Forex market is likely to be best traded by playing ranges over the coming week, which would mean looking for reversals from the support and resistance levels given above. I would not pay much attention to what the US Dollar is doing over the coming week.
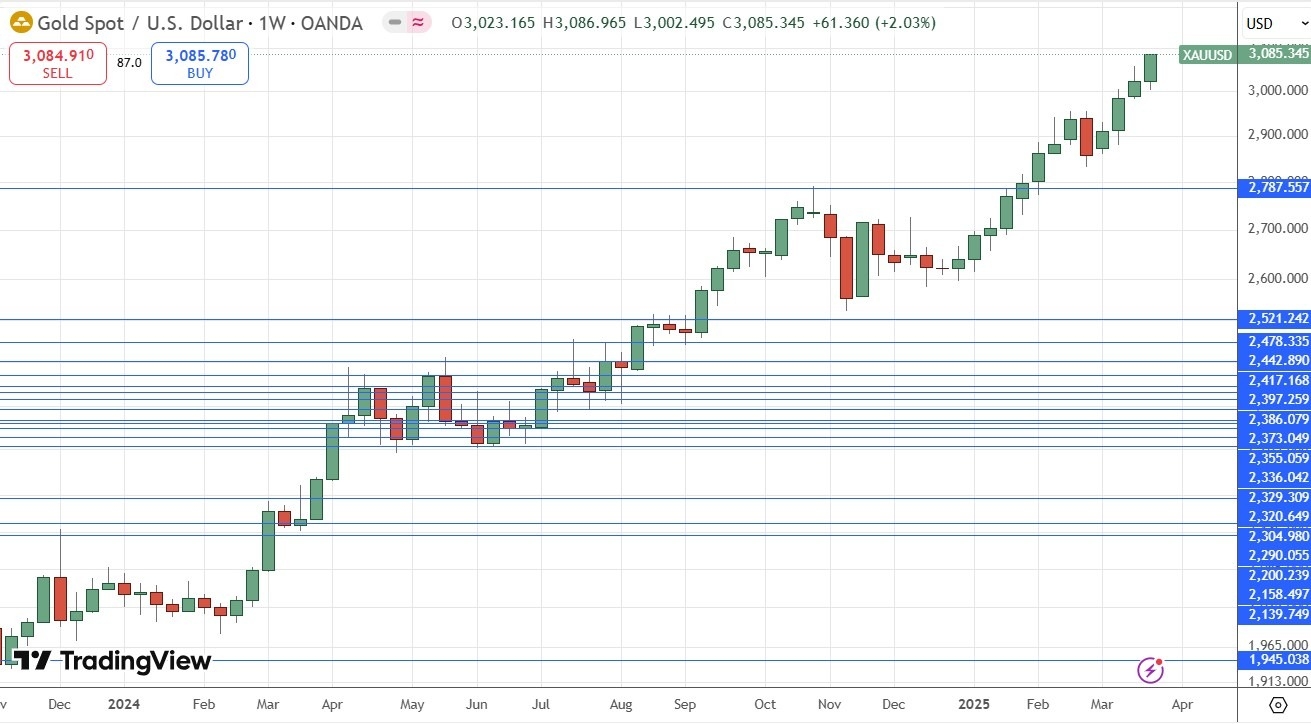
Gold rose firmly last week to reach a new record high just below the round number at $3,100. The price closed the week extremely close to its high, which is a bullish sign suggesting strong momentum.
The price closed at a new all-time high as a weekly closing price.
Many analysts think that Gold is being boosted by safe-haven flow, with the Japanese Yen less attractive due to high volatility, while the US Dollar is unattractive due to of the ongoing US-centered trade war. This is becoming more plausible. Gold is usually positively correlated with stock markets, but that correlation seems to have become uncoupled for now.
I see Gold as a buy right now. This has been a good run – for a bullish trend, and now it is well established above the big round number at $3,000.
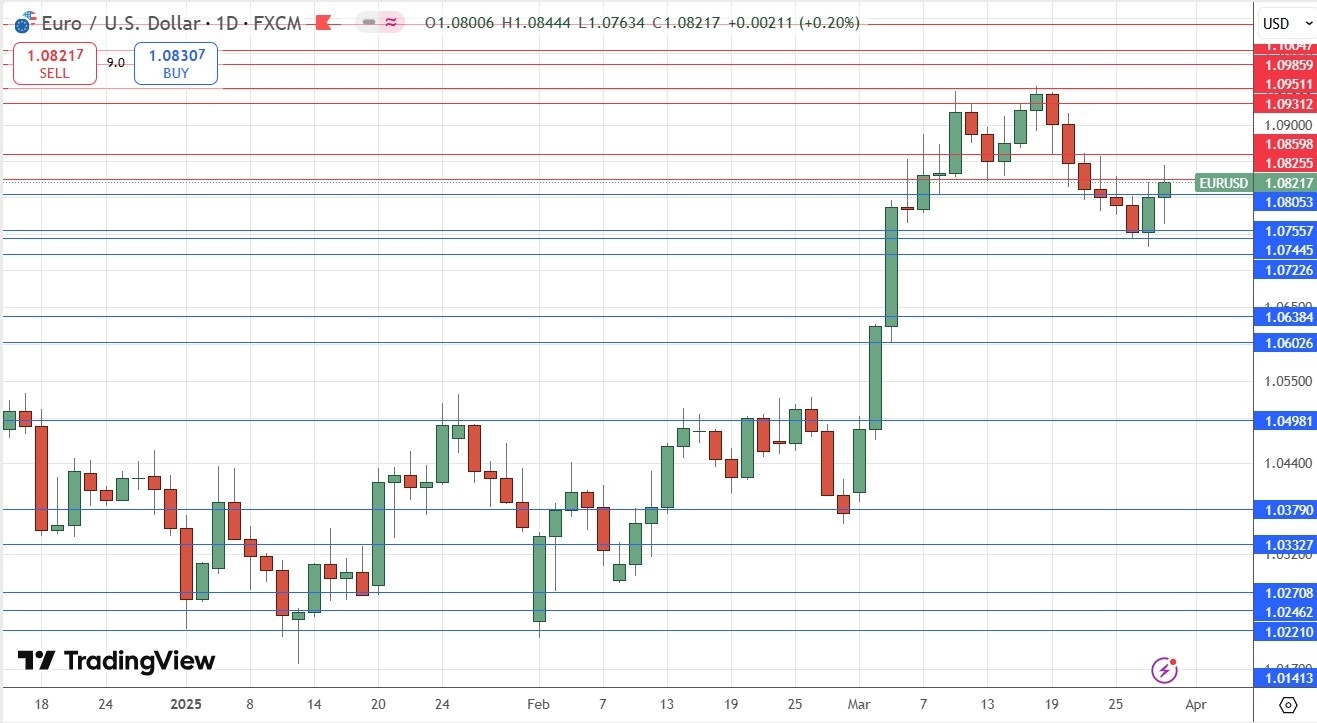
The EUR/USD currency pair rose slightly over the past week, printing a small bullish pin bar on the weekly chart. The daily chart shown below shows that the price recovered but is still some way off breaking to a new high price above $1.0951.
I have no strong belief that this is likely to happen, but if the price makes a strong bullish move and goes on to make a new high as a daily (New York close) above the resistance level at $1.0951, that will represent a valid bullish breakout entry within a valid long-term bullish trend, and I would take it.
This currency pair tends to trend very reliably, so if we see such a breakout I think it will be worth a long trade.
The USD is still showing weakness due to the ongoing trade war. President Trump has promised to impose new tariffs on 2nd April which is this Wednesday, so we might see a reaction to whatever is announced and that might be a rise here which could break to a new high.
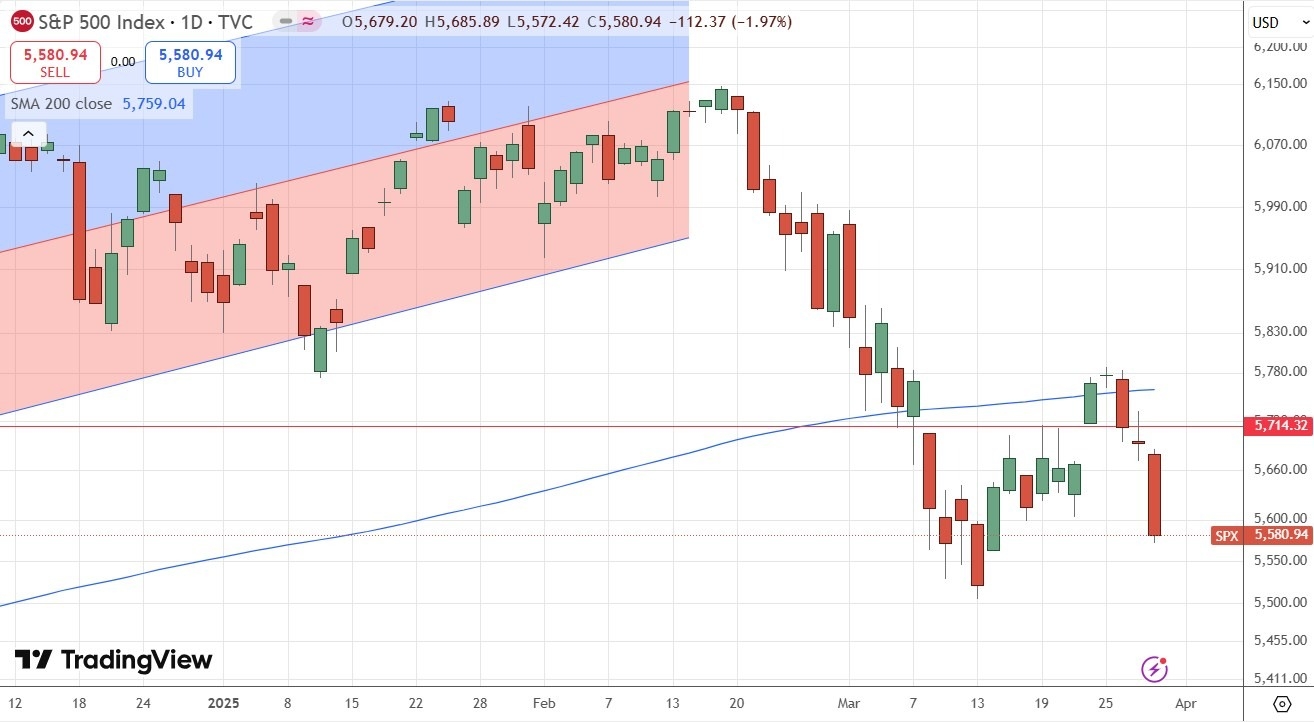
The S&P 500 Index fell last week, after making two successive daily closes above the 200-day simple moving average which is shown within the daily price chart below. Friday’s fall was strong, on bad auto tariff news and a higher than expected US inflation indicator. The price ended the week not far from its recent multi-month low.
The main reason for the strong drop in most global stock markets, and the major US indices in particular, is of course the large tariffs President Trump has imposed on US imports and is threatening to impose next Wednesday, although he has been trying to prop up the market at least a little by saying people will be pleasantly surprised when he makes the announcement.
The classic indication of a bear market is when a price is at least 20% off its high. The price is still quite far from getting to that level, but the sustained trading below the price of 6 months ago and the key 200-day simple moving average are bearish signs. As we are now at the end of a calendar month, I will be reducing my long-term investment in the US stock market and will be seeking to get out entirely unless we start to see a recovery in April.
Short trades are possible but dangerous for beginners. The best opportunity I can see which might set up is if the price tests the area of resistance confluent with the 200-day moving average at 5777. A bearish reversal there, especially if it also rejects the moving average, could be an excellent short trade entry signal.
Much will now probably depend upon what President Trump announces next Wednesday.
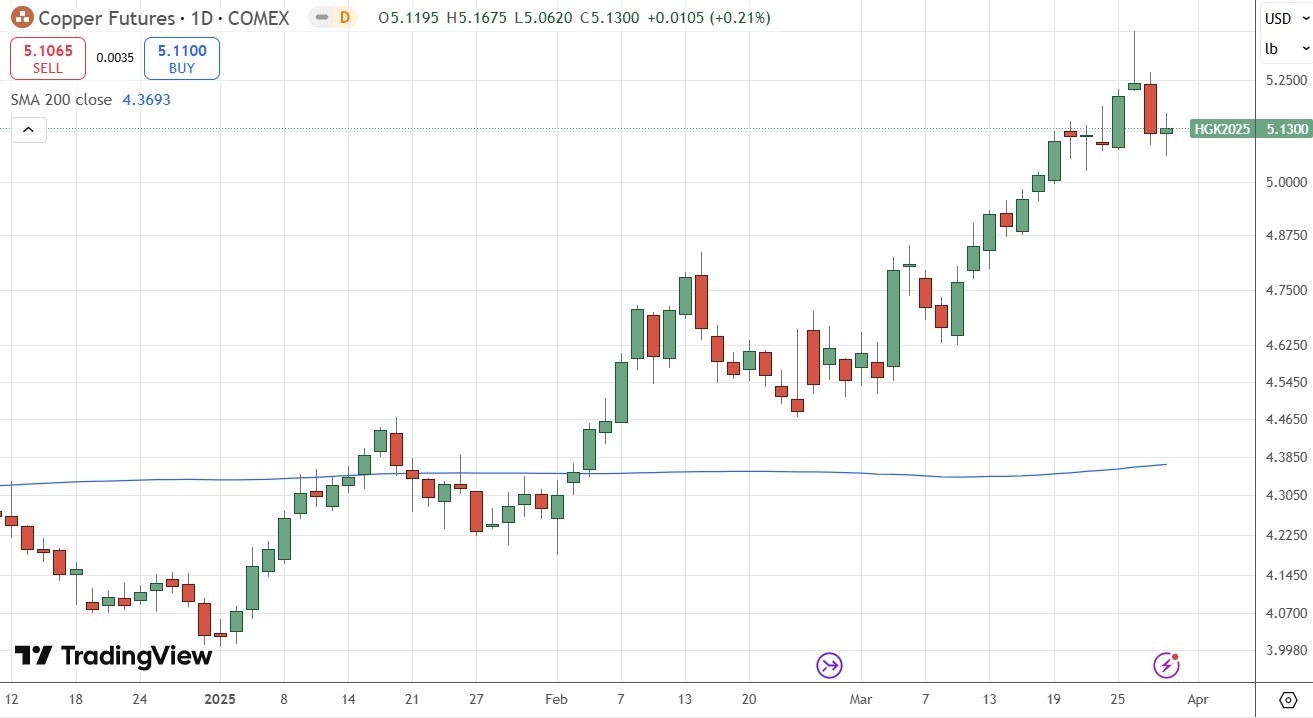
US Copper futures reached an all-time high last week, before falling sharply halfway through the week and closing markedly lower. This will have been a strong enough drop to shake out many trend traders from long positions in Copper.
Copper is not necessarily done with its bullish trend yet, but I see this as a buy only after the price makes a new daily high closing price with a bullish candlestick above $5.25.
Another bearish factor which makes me pessimistic is the large pin bar we see which both printed the all-time high and rejected the big quarter-number at $5.25 last week.
I see the best trades this week as:
- Long of Gold.
- Long of EUR/USD following a daily close above $1.0951.
- Long of US Copper futures following a daily close above $5.25.
Ready to trade our weekly Forex forecast? Check out our list of the top 10 Forex brokers.
