I wrote on 11th May that the best trades for the week would be:
- Long of Gold following a daily (New York) close above $3,432. This did not set up.
- Long of Bitcoin following a daily (New York) close above $106,187. This did not set up.
- Short of the USD/MXN currency pair. The price fell by 0.22% over the week.
The overall win of 0.22% equals a win of 0.07% per asset.
Last week saw slightly lower than expected US inflation, while PPI, another inflation indicator, came in much lower than was expected. There has also been continued progress by the USA in drumming up new trade and trade deals to replace proposed tariffs, notably the memorandums signed by Saudi Arabia, Qatar, and the UAE, which the Trump administration claims will be worth something like $1.8 billion to the US economy, although the size is disputed.
We have seen a continued improvement in stocks and in some commodities too, while the US has bucked its long-term bearish trend for another week, moving a bit higher.
Last week’s most important data releases were:
- US CPI (inflation) – unexpectedly fell from 2.4% to 2.3%.
- US PPI – was expected to show a 0.2% increase on the month, it fell by 0.5%, suggesting deflationary pressure.
- US Preliminary UoM Inflation Expectations – contradictorily, this moved higher.
- US Preliminary UoM Consumer Sentiment Expectations – lower than expected.
- UK GDP – slightly higher than expected, showing a 0.2% increase on the month when no change was expected.
- Australia Wage Price Index – this came in a fraction higher than expected.
- US Unemployment Claims
- UK Claimant Count Change (Unemployment Claims)
The coming week has a less important schedule of high-impact data releases.
This week’s important data points, in order of likely importance, are:
- UK CPI (inflation)
- RBA Cash Rate & Rate Statement
- Canada CPI (inflation)
- USA, Germany, UK, France Flash Services / Manufacturing PMI
- UK Retail Sales
- Canada Retail Sales
- US Unemployment Claims
The most impactful events on the Forex market will likely be the RBA policy meeting, followed by the two items of inflation data.

For the month of May 2025, I made no monthly forecast as although there was a long-term trend against the US Dollar, the price action suggested that a major bullish reversal could be underway.
As there were no unusually large price movements in Forex currency crosses over the past week, I make no weekly forecast.
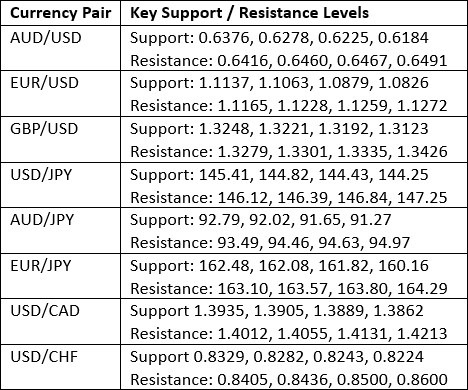
The US Dollar was the strongest major currency last week, while the Euro was the weakest, although the values were relatively low. Volatility decreased again last week, with not one of the most important Forex currency pairs and crosses changing in value by more than 1%. Next week’s volatility is likely to remain relatively low.
You can trade these forecasts in a real or demo Forex brokerage account.
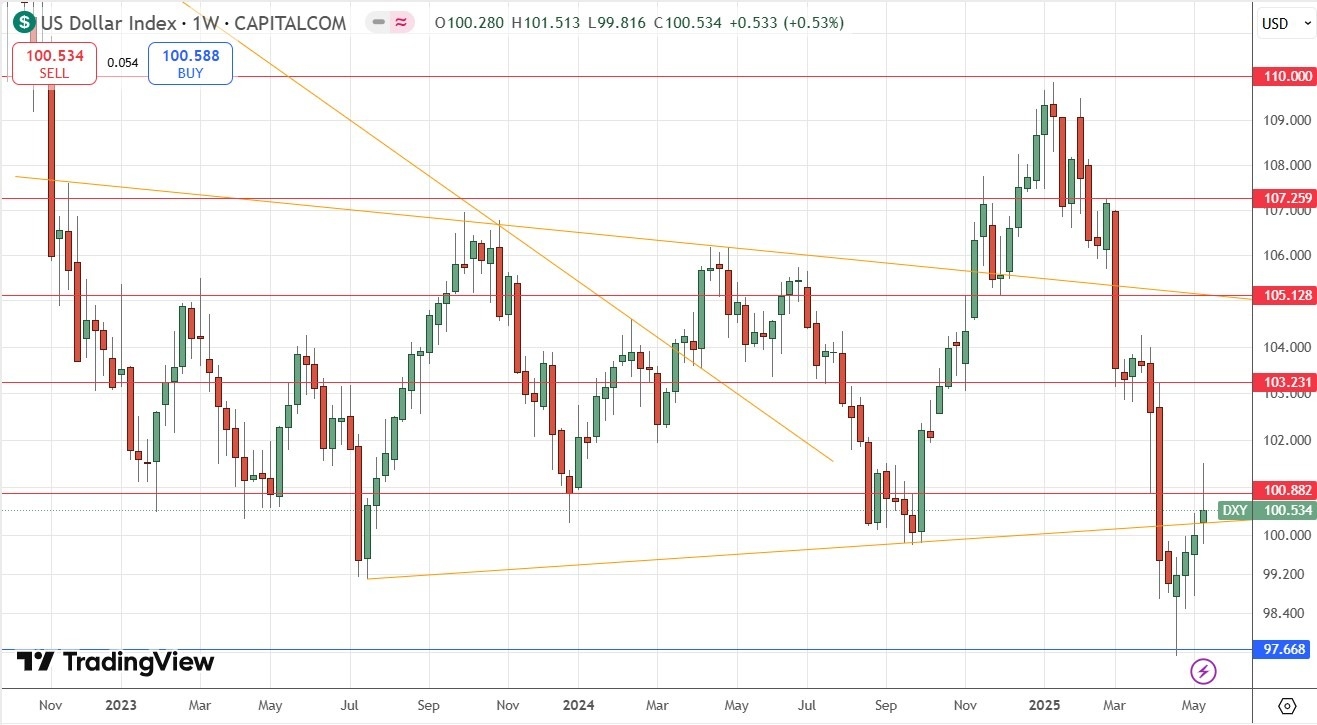
Last week, the US Dollar Index printed a candlestick which closed higher for the fourth week in a row. However, the candlestick has a large upper wick and looks a little like a bearish pin bar after rejecting the resistance level at 100.88. The price reached a new 4-year low four weeks ago before bouncing strongly off the support level shown in the price chart below, at 97.67. As the rise has continued, these are bullish signs, but the long-term bearish trend is a bearish sign, and the rise seems to be running out of momentum
It is hard to say what will happen to the US Dollar next week after this bullish bounce, but trading in line with the long-term trend would be short of the greenback. If there is short-term bearish momentum, you might be more confident in going short here. If the price remains below 100.88 that will be another bearish sign.
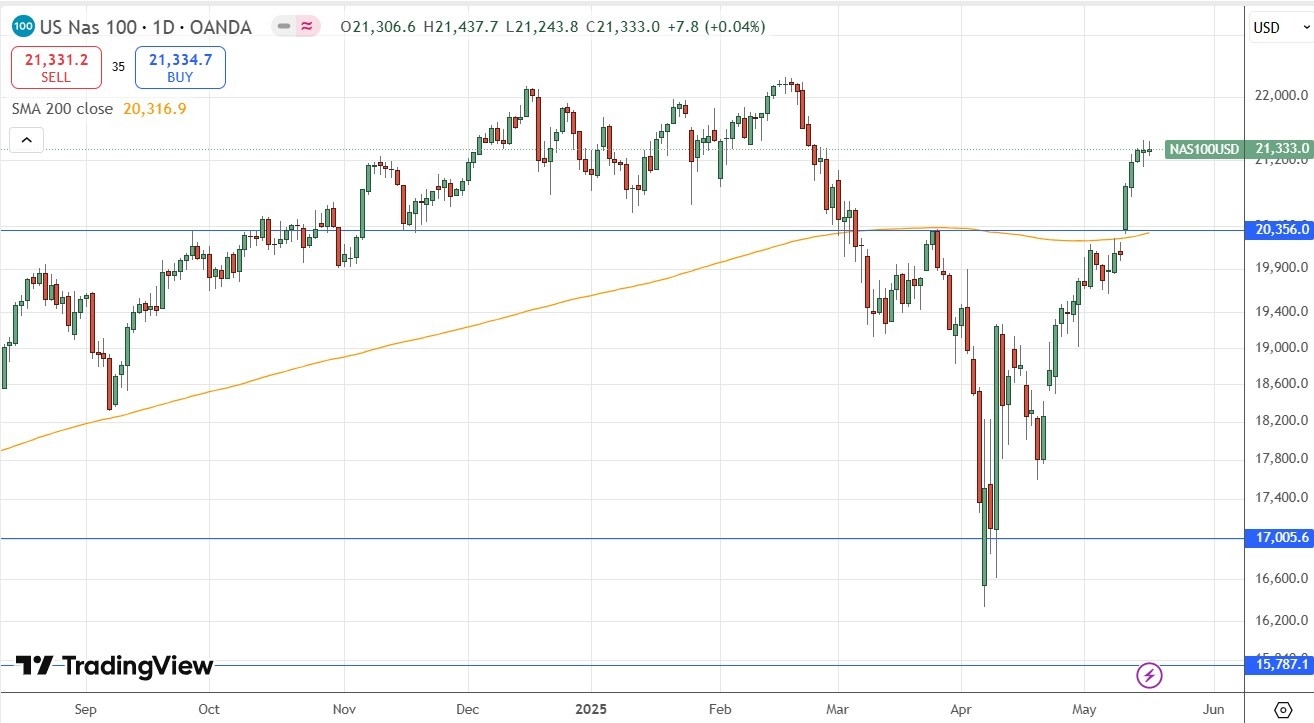
The NASDAQ 100 Index rose firmly last week as risk-on sentiment continued to solidify, helped by pledges from Qatar, Saudi Arabia, and the UAE to complete large trade agreements with the USA.
This rise puts the price well above the 200-day moving average, as can be seen in the daily chart below. The price ended the week near the high of the week, which is a bullish sign, although momentum faded at the end of the week.
The price closed only 800 points from the all-time high which this index made in February.
The outlook is certainly more bullish. I will be very happy to go long of this Index in the unlikely event that we get a daily close above 22,161.
The NASDAQ 100 index is worth considering seriously on the long side as it has such an amazingly good record of positive returns since the Index was created in the 1980s, easily beating broader US indices such as the S&P 500.
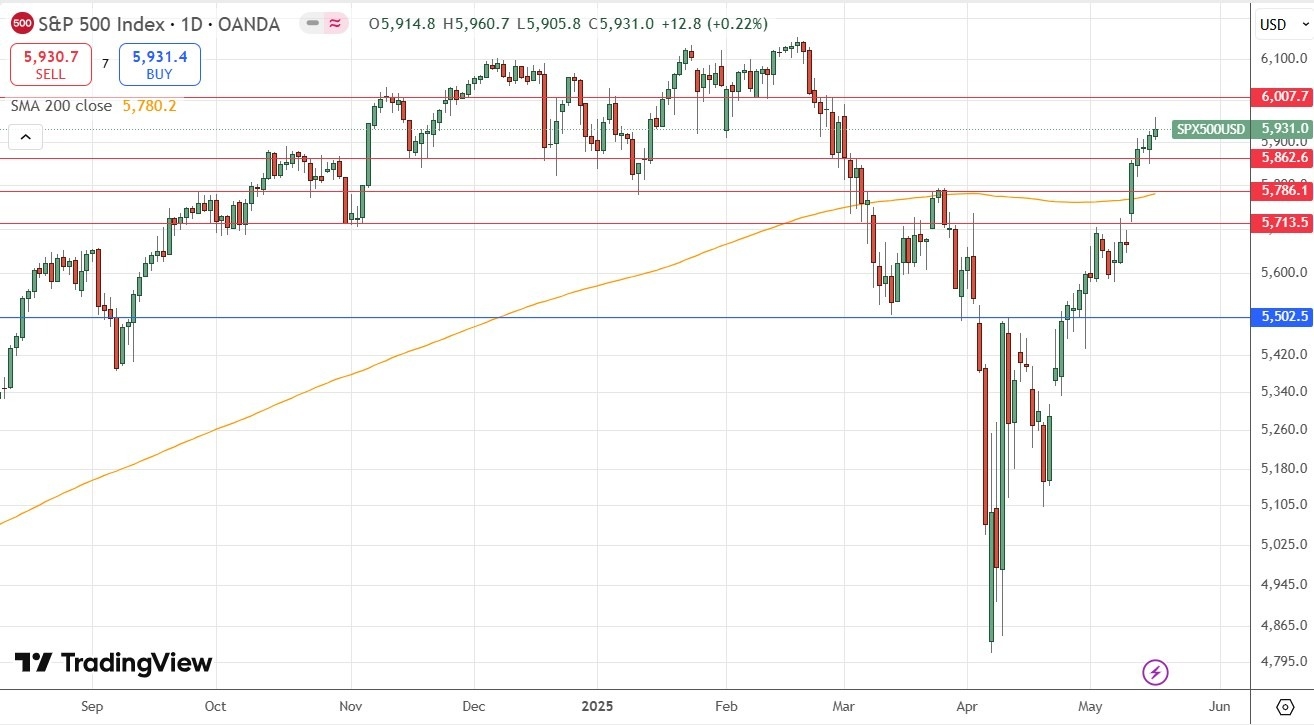
The S&P 500 Index rose firmly last week as risk-on sentiment continued to solidify, helped by pledges from Qatar, Saudi Arabia, and the UAE to complete large trade agreements with the USA.
This rise puts the price well above the 200-day moving average, as can be seen in the daily chart below. The price ended the week near the high of the week, which is a bullish sign. Another bullish sign is that the price was still rising on the last couple of days of last week, unlike the NASDAQ 100 Index.
The price closed only about 200 points from the all-time high which this index made in February.
The outlook is certainly more bullish. I will be very happy to go long of this Index in the unlikely event that we get a daily close above 6,142.
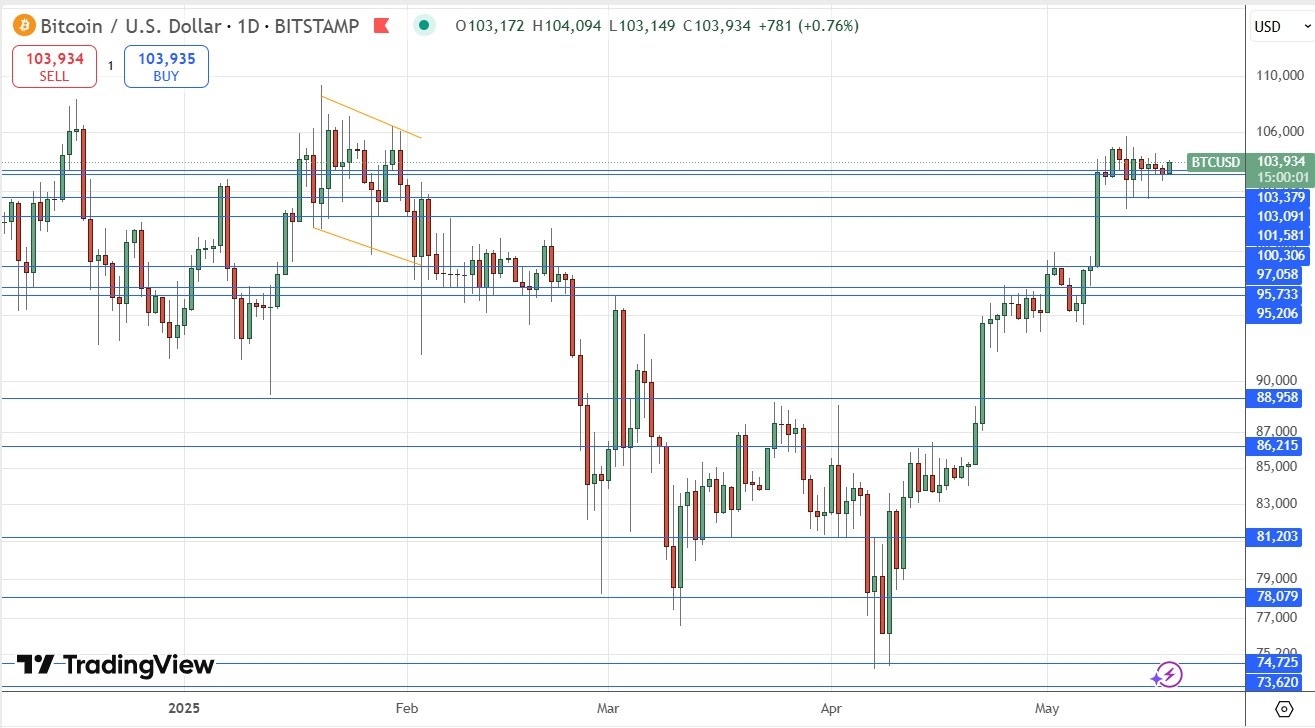
Bitcoin spent the week consolidating but look at the daily price chart below to see just how bullish that consolidation was. The price has clearly held up cleanly from the $102,750 area. As I write, the price looks like it might be heading for a significant bullish breakout right now, which I would describe as the area above $105,000.
Despite this bullish outlook, it is worth nothing that the highest daily closing price should still be exceeded before entering a new long trade here, and that is further ahead at $106,187. Some traders will want to be even more cautious and wait for a new absolute high to be made above $109,000 or even for the price to clear the more significant round number above that at $110,000.
It is hard to say why Bitcoin is suddenly now looking so bullish apart from the continually improving risk-on sentiment which is dominating markets right now.
I will enter a new long trade if we get a daily (New York) close above $106,187 this week.
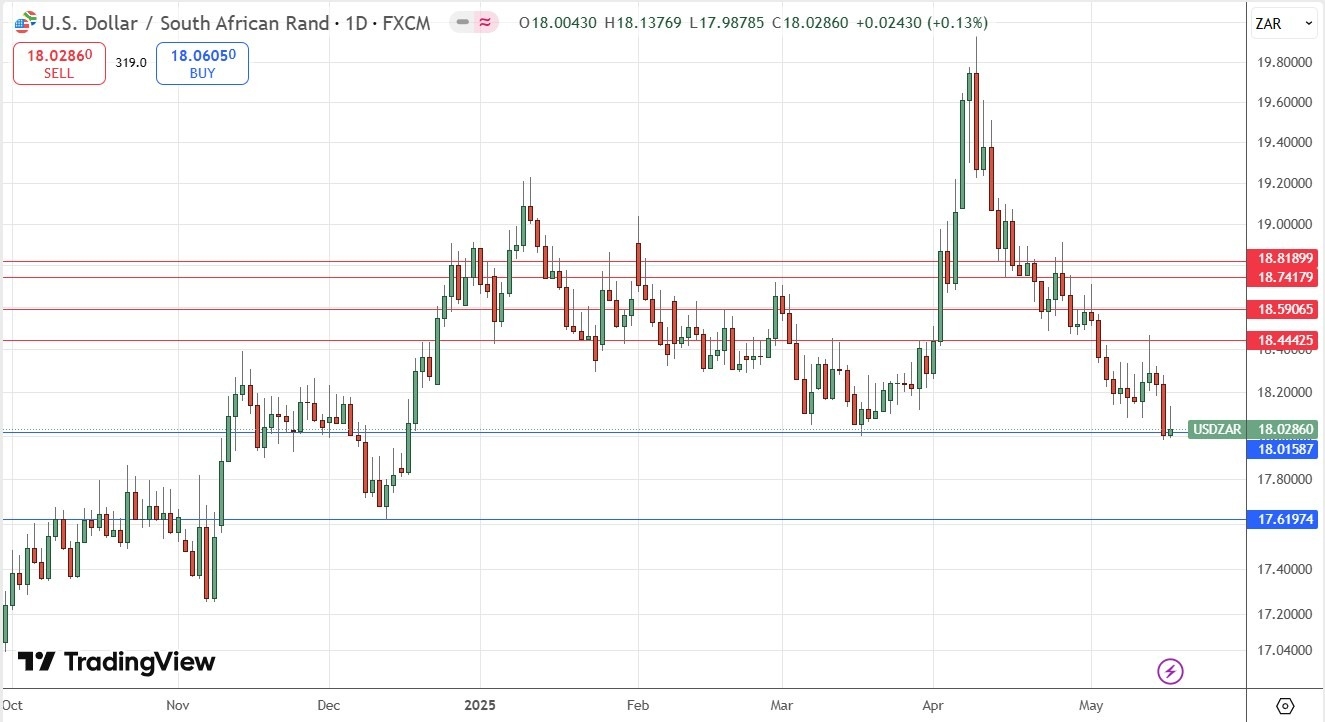
The USD/ZAR currency pair looks very heavy as it sits on the support level at 18.0159, which seems to be the only thing which is preventing the price from making a very significant bearish breakdown to new 5-month low prices.
The daily candlestick chart below shows we are experiencing quite bearish price action, suggesting there will be a breakdown. There are no support levels for a long way down, so we might see such a breakdown producing a significant drop making a short trade attractive.
The US Dollar has become more attractive as we get progress on trade deals mitigating Trump’s tariffs, while the South African Rand is plagued by the weaknesses inherent to the South African economy, not to mention South Africa’s relatively poor standing with the US Presidency and Congress.
I will be happy to enter a short trade once we get a daily (New York) close below 17.98, targeting the support level at 17.62.
I see the best trades this week as:
- Long of the NASDAQ 100 Index following a daily (New York) close above 21,161.
- Long of the S&P 500 Index following a daily (New York) close above 6,142
- Long of Bitcoin following a daily (New York) close above $106,187.
- Short of the USD/ZAR currency pair following a daily (New York) close below 17.98.
Ready to trade our weekly Forex forecast? Check out our list of the top 5 Forex brokers in the world.
