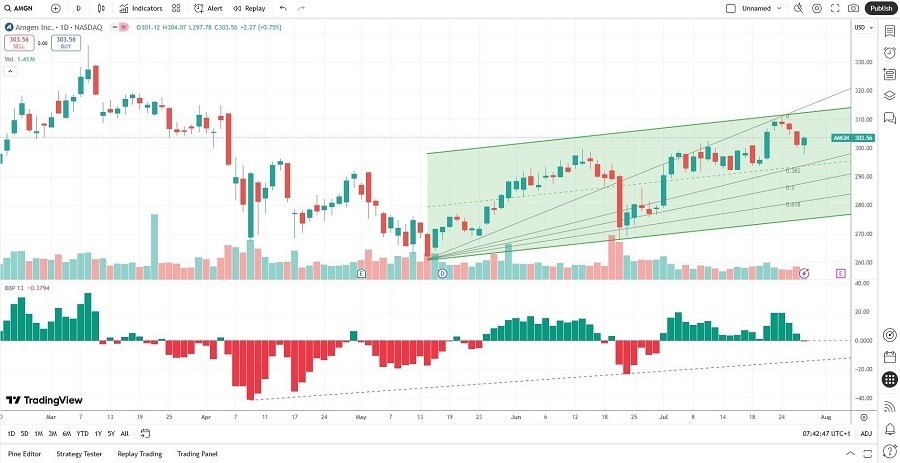
Long Trade Idea
Enter your long position between 297.78 (yesterday’s intra-day low) and 304.07 (yesterday’s intra-day high).
Market Index Analysis
- Amgen (AMGN) is a member of the NASDAQ 100, the Dow Jones Industrial Average, the S&P 100, and the S&P 500.
- All four indices remain near record highs, but the underlying technical picture flashes warning signs.
- The Bull Bear Power Indicator of the NASDAQ 100 shows a negative divergence.
Market Sentiment Analysis
Equity markets appear to brush off the latest developments in the US-China trade talks. Today’s overhyped FOMC announcement is unlikely to offer new insights. Markets expect the US Fed to keep interest rates unchanged with a similar statement as before. Tariff uncertainty persists, and businesses and consumers continue to feel its impact. It will take time for the effects to ripple through the supply chain, and the US central bank will monitor developments despite political pressure. Earnings should drive today’s price action.
Amgen Fundamental Analysis
Amgen is the 18th largest biomedical company by revenues, a Fortune 500 company, and it has 17 clinical programs in Phase III, eight in Phase II, and 19 in Phase I.
So, why am I bullish on AMGN ahead of its earnings release?
Amgen has a deep pipeline, and it performs well in any economic scenario, as it sells life-saving medicine. AMGN experienced a few trial setbacks, and some patents will expire, but it has shown its operational excellence throughout similar conditions. It also pays a nice dividend yield, and its gastric cancer drug is nearing approval, which could catapult shares higher.

The price-to-earnings (P/E) ratio of 27.70 makes AMGN an inexpensive stock. By comparison, the P/E ratio for the NASDAQ 100 is 41.57.
The average analyst price target for AMGN is 313.48. It points towards moderate upside, but I believe upward revisions are likely due to its approaching drug approval.
Amgen Technical Analysis
Today’s AMGN Signal

- The AMGN D1 chart shows price action inside a bullish price channel.
- It also shows price action grinding higher between its 0.0% and 38.2% Fibonacci Retracement Fan level.
- The Bull Bear Power Indicator dipped into bearish territory yesterday, but the trendline is bullish.
- Average trading volumes are higher during rallies than during selloffs.
- AMGN moved higher with the NASDAQ 100, a significant bullish sign.
My Call
I am taking a long position in AMGN between 297.78 and 304.07. The PEG ratio suggests more future upside. I am optimistic about its gastric cancer drug approval, and the dividend yield suffices to hold AMGN in long-term portfolios.
- AMGN Entry Level: Between 297.78 and 304.07
- AMGN Take Profit: Between 335.88 and 352.67
- AMGN Stop Loss: Between 283.64 and 288.36
- Risk/Reward Ratio: 2.69
Ready to trade our free stock signals signals? Here is our list of the best brokers for trading worth reviewing.
