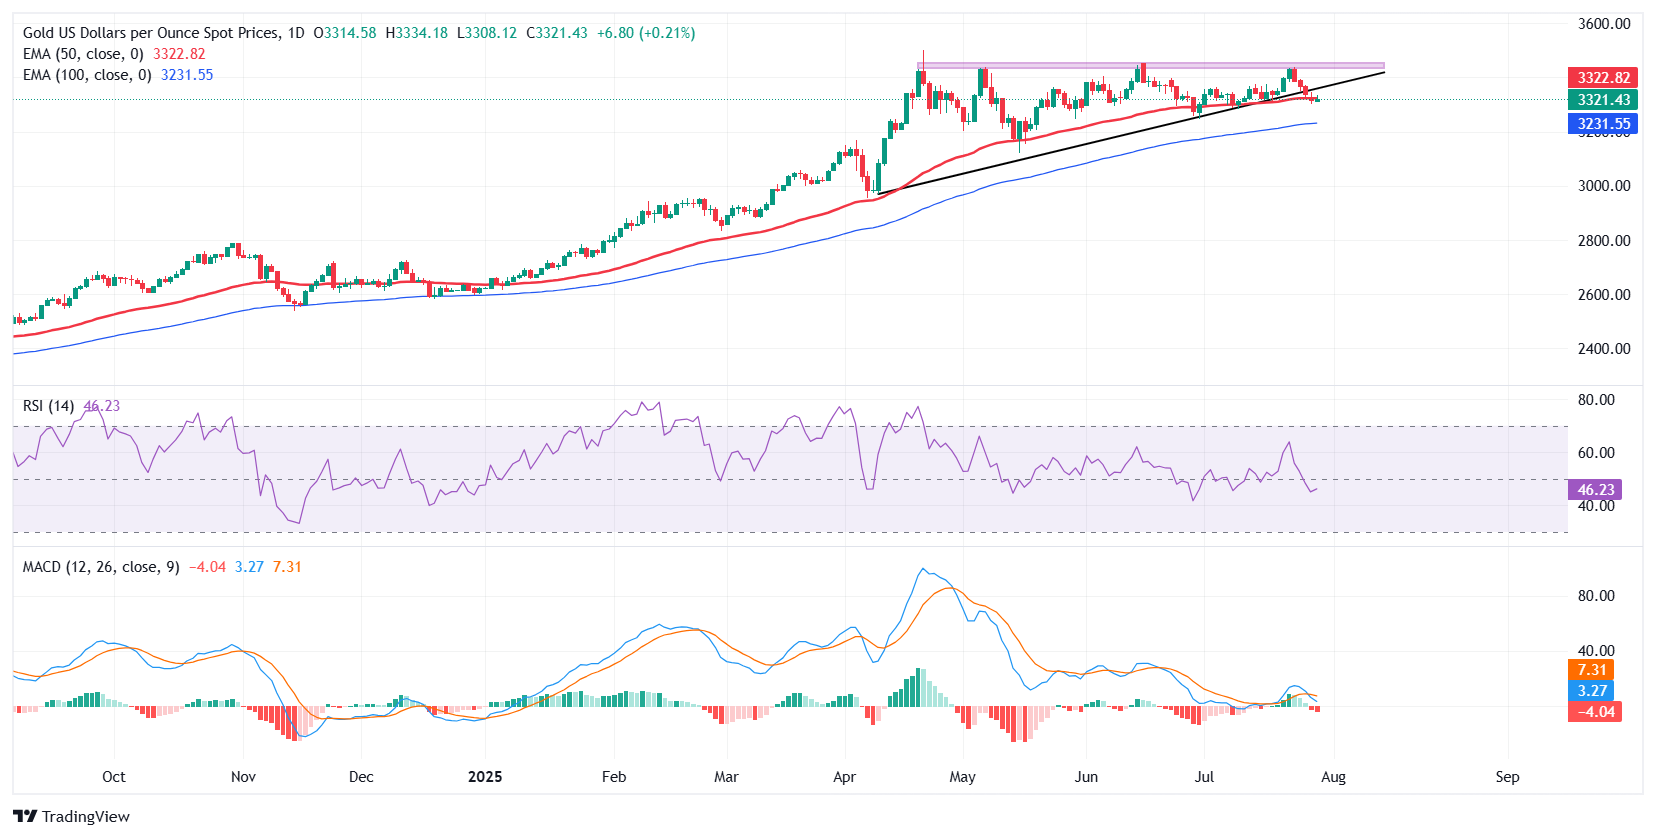
- Gold (XAU/USD) steadies around $3,321 on Tuesday, halting a four-day losing streak after hitting a near three-week low of around $3,300.
- Risk-on sentiment and easing geopolitical tensions ahead of the August 1 deadline continue to cap safe-haven demand.
- Markets remain cautious ahead of the Federal Reserve’s monetary policy decision on Wednesday.
Gold (XAU/USD) steadies on Tuesday, halting a four-day slide after dipping to a near three-week low around $3,300 on Monday. The slight rebound comes despite a broadly risk-on mood that has kept demand for safe-haven assets subdued. Optimism around easing geopolitical tensions ahead of the August 1 deadline and a renewed push into equities have curbed upward momentum for the metal.
At the time of writing, the precious metal is trading around $3,321 during the American session, little changed on the day. Price action remains muted, with Gold oscillating in a narrow range between $3,300 and $3,330. While spot price found temporary support, its upside remains constrained by a firm US Dollar (USD), which continues to benefit from improving trade sentiment and solid economic data.
With the Federal Reserve’s (FED) policy decision looming on Wednesday, markets are bracing for potential shifts in tone. Although interest rates are expected to remain unchanged, any hawkish signals from Fed Chair Powell could drive US yields higher and weigh further on non-interest-bearing assets such as Gold.

From a technical perspective, XAU/USD is testing a key confluence zone on the daily chart, where the 50-day Exponential Moving Average (EMA) at $3,322.79 overlaps with a rising trendline support drawn from March lows. While the price is currently trading marginally below the ascending trendline, the breach lacks strong momentum, suggesting it may be a false breakout. The metal remains in a broader uptrend, but short-term momentum has weakened, suggesting indecision as traders await the next catalyst, likely the Fed’s monetary policy decision on Wednesday. A clear breakout above $3,350 could trigger a bullish continuation, while a breakdown below the 50-EMA may expose the 100-day EMA near $3,231.50.
Momentum indicators tilt bearish but lack conviction. The Relative Strength Index (RSI) has slipped below the neutral 50 mark, currently at 46.10, indicating weakening bullish momentum with further room to enter oversold territory. The Moving Average Convergence Divergence (MACD) indicator also remains in postive, with the MACD line crossing below the signal line and the histogram printing small red bars, pointing to mild downside pressure.

