Long Trade Idea
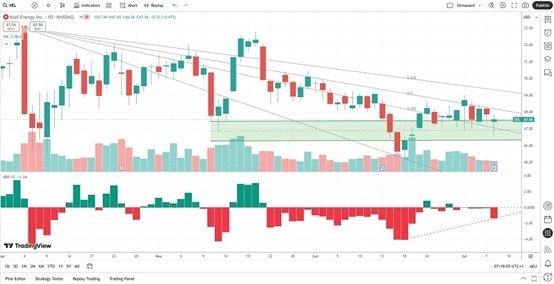
Enter your long position between 66.64 (the lower band of its horizontal support zone) and 67.83 (yesterday’s intra-day high).
Market Index Analysis
- Xcel Energy (XEL) is a member of the NASDAQ 100 and the S&P 500.
- Both indices are near record highs, but trading volumes during sell-off have increased, suggesting a potential breakdown of the uptrend
- The Bull Bear Power Indicator of the NASDAQ 100 shows a negative divergence, and half of a head-and-shoulders pattern, a reversal chart pattern.
Market Sentiment Analysis
Equity markets continue to assess the latest round of tariff news and weigh it against the initial market shock of April. The impressive V-shaped recovery during the second quarter now faces more uncertainty against the backdrop of high inflation, higher-than-expected interest rates, and a cooling economy. Recent comments about a tariff-related inflation spike and comparing them to the risk of a meteor strike or another pandemic show the economic disconnect of current policy, which adds to the risks of a third-quarter correction.
Xcel Energy Fundamental Analysis H2
Xcel Energy is a US-regulated electric utility and natural gas company with four subsidiaries serving Colorado, Minnesota, Wisconsin, Michigan, North Dakota, South Dakota, Texas, and New Mexico. It is also a major player in the green energy transition.
So, why am I bullish on XEL despite its recent correction?
XEL presents an attractive defensive portfolio addition with signs of a sustained technical breakout. It has some balance sheet issues and has underperformed in return on invested capital, but I believe its outlook is much brighter than its share price suggests. Its dividend, which increases by over 6% per year, adds an incentive to hold Xcel Energy. I predict market outperformance during the third quarter, especially if equity markets enter a correction.
|
Metric |
Value |
Verdict |
|
PE Ratio |
19.87 |
Bullish |
|
PB Ratio |
1.97 |
Bullish |
|
PEG Ratio |
2.69 |
Bearish |
|
Current Ratio |
0.80 |
Bearish |
|
ROIC-WACC Ratio |
Negative |
Bearish |
The price-to-earning (PE) ratio of 19.87 makes XEL a considerably cheap stock. By comparison, the PE ratio for the S&P 500 is 28.75.
The average analyst price target for XEL is 75.06. It suggests reasonable upside potential from current levels.
Xcel Energy Technical Analysis
Today’s XEL Signal

- The XEL D1 chart shows price action at a significant horizontal support zone.
- It also shows a breakout above the 38.2% Fibonacci Retracement Fan level.
- The Bull Bear Power Indicator is bearish but has improved and is flirting with a bullish crossover.
- The average trading volumes during rallies are higher than during selloffs.
- XEL advanced while the S&P 500 corrected, a bullish confirmation.
My Call H2
I am taking a long position in XEL between 66.64 and 67.83. Xcel Energy trades at a strong horizontal support zone with candlestick pattern confirmation. It also completed a significant breakout, ending its bearish stance. Therefore, I can forgive select balance sheet issues, as XEL has attractive upside potential, especially in a defensive market. I will buy the dips moving forward.
- XEL Entry Level: Between 66.64 and 67.83
- XEL Take Profit: Between 73.00 and 75.02
- XEL Stop Loss: Between 64.29 and 65.43
- Risk/Reward Ratio: 2.71
Ready to trade our free signals? Here is our list of the best stock trading platforms worth checking out.

